wallstreetwarrior87
Senior member
- Messages
- 2,068
- Likes
- 389
Still no volume down here, time of day not helping, bide your time, wait until the hand is shown, upside target still in play, just looking to get the best price for an entry -

What they call "Wyckoff Unleashed" is not the original course. The original course is free and may be found in this link. It takes time and considerable effort to fully understand it, but Wyckoff's principles still apply a hundred years later, so whether or not one is able to make use of them, he should nonetheless at least be aware of them.
As for "accumulation", you may reach an understanding of it more easily if you understand that accumulation is a process, not an event. Therefore it takes place in a range, not in a climactic move. I suggest you use "Ctrl+F" and "accumulation" with Wyckoff's course to read what he has to say about it.
If you are interested chiefly in an introduction to Wyckoff rather than a 400-page course, see the link in my signature.
Db
Hi Fibo - what in particular are you looking for in volume??
No - what gave you that idea?Anyone else think this thread was going to be about crypto?
stealth busted by vol TLX = Big boys are delivering W1 up in vol. You must buy/enter/accumulate during W2 down vol. If you wait for the vol blast (W3) its already late for accum. Best stop ever goes right under W1 vol accum
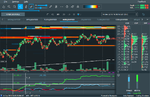
check the volume bars and a great tool to use is Bookmap heat map.it shows graphically which aggressors absorb the otherHey fine folks!
As the title says...
How does one identify when accumulation is taking place?
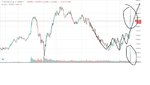
For anyone still keeping an eye on Howdens, the price made its way into the highs (circle 3) just falling short of 580 ATH, with stand out volume (ie guaranteed liquidity) for the controlling players to off load their previously accumulated longs. Price still just shy of 600 so maybe a few traders will still have a go, but it will be without major player interest, as they have done what they needed, and will now move on to another asset and do the same thing over again.I dont have any material as such, as I think that it is far more beneficial to the individual if they work it through themselves, that way, it becomes their understanding and is not simply taken as gospel by some publicised expert.
No videos either - BUT as Howdens has been mentioned, we can use that as a REAL TIME example.
The problem with Wykoff etc is that it is based around the past and what's happened, but seldom explains what will be the likely outcome/development based on all the running commentary, in all fairness it points points out the obvious. This is not to have a go at Wykoff theory or anyone who uses it, each to their own, if they find value, but it only takes you so far. It doesn't take you into the future (or likely events in the future), which as traders we would like to strive for (well maybe not everyone), but it needs to be more than guessing! There needs to be REASON.
Anyway blabbering, back to the Howdens chart - have a peek 😵
First black circle, obvious ACCUMULATION, obtaining a good average price by medium term SWING TRADERS (typically build and distribute over roughly 6-8 month periods, give or take a few weeks, and depending on opportunities that may occur in this time period. 2nd black circle is opportunistic accumulation due to the apparent double top/resistance (orange line) set up causing retail traders to jump in short. Please note that if this didnt occur, then there would have been no extra accumulation at this point in time.
So shares have been herded up, now there needs to be a target to start off loading/distributing. Guaranteed business is always present at new highs!!!! But this time (red circle 1) there aint a massive amount of demand about, volumes are very low considering we are about to bust to ATHs. So only part distribution has been accomplished at this juncture. Big boys still hold massive longs here!
Brown circle 2 is NOT accumulation - it is PROTECTION (PPT if you like for the specialists in this stock). A MASSIVE influx of sellers have come into the market, as they now see a potential top in the market (black line). These guys have to interact in the brown circle as they cant afford the stock to drop too far, as they still need to get out of their remaining positions!
But now we know we must off load "into and at" the next high, as we have had the EVIDENCE that sellers want to short this stock.
Total distribution will be concluded into red circle 3, this will also be the area at which the traders whom have shorted the market in the brown circle will have their stops (hence guaranteed volume in this location). Whats worse for them, is that they will then switch long as we are now at new highs, but we wont go much further now that the major players are now flat at least.
Shorter term swing traders will accumulate short positions at these highs, knowing that they are not trading against the longer term swing traders. Once they have absorbed the last few buyers, View attachment 263293 the market should logically drift and drop hard. This should happen as we already have background information suggesting overall demand is weak anyway (due to what happened in circles 1 and 2).
And the gig goes on and on at each point in time.
So hopefully you can see why it is important to try to get a grasp on WHO is doing WHAT and WHY. Granted, as I said before, this level of analysis is not needed to be profitable, but if you can grasp it 👍🤔☕ the world is your oyster lol. Seriously, you can add into positions when others are sh**ting themselves, with the knowledge of what the market needs to give those whom have showed their intent, and also you can dump ASAP when you can see that the market aint giving them what they need. But this doesnt happen over 1 distribution line - just look at any crash!!! Oh and yes who bl**dy causes them😱
Hope this helps anyone whom maybe interested in seeking this path for themselves. Each to their own. Many men (women), many methods - - - -