Deadline June

Re: Optimisation & out-of-sample periods - art not science

(1) most of the FXCM data for my chosen forex pairs starts in 2008 - although I do have the data for the core forex pairs going back to 2006.

Hi Adamus,

If you're looking for raw data from FXCM, we have 1 minute data available for most pairs going back to 2001. The data can also be imported into the Strategy Trader platform. Here's where to find it http://forexforums.dailyfx.com/free...967-free-strategy-trader-historical-data.html

-Jason
 
Re: as close to science as possible

[snipped ....]
So we could add a third principle:

3. The out-of-sample has to be at least twice as long as the average drawdown for a system (of the type you create), so that a good system will have time to recover from a drawdown AND to make money, within the duration of the out-of-sample. If a system has drawdowns that last one year from peak to peak, then you need an out-of-sample of at least 2 years: one year for the drawdown, and one year to produce profit. But since we don't know from the start how long the worst drawdown will be, we should be on the safe side and have an out-of-sample lasting three times as long as the expected max drawdown (from peak to peak).

Yes that principle makes sense, for robust systems, which is obviously what I want. In terms of an optimisable system like the one I just discarded, it still makes sense too, although many optimised systems work best (or perhaps only) when regularly re-optimised. But I've never had any luck finding one of those type of systems that worked on a high enough proportion of out-of-sampe periods.

So for 3 years out-of-sample, I'll use 2001 - 2008 inclusive as the optimisation window and 2009 & 2010 and 2000 are the out-of-sample.
 
Last edited:
FXCM back 2001

Hi Adamus,

If you're looking for raw data from FXCM, we have 1 minute data available for most pairs going back to 2001. The data can also be imported into the Strategy Trader platform. Here's where to find it http://forexforums.dailyfx.com/free...967-free-strategy-trader-historical-data.html

-Jason
Hi Jason,

thanks v. much for the link. 2001 is good. I'm looking forward to using it. I've searched up and down the net for about a year now for forex data this far back and you can't get it for love nor money unless it's Disktrading and their data gets distinctly patchy when you go back that far. Having the bid and ask seperately is new to me two - I can see it offers some interesting possibilities but I'll have to see exactly what I can do.
 
Re: New system (for me) - FirstStrike

This is the performance of First Strike unoptimised from 2001 through 2008 as following the rules above but with a slight change that I came across accidentally. Sometimes it pays to make mistakes and I just coded the entry stops against the wrong Open. It should have been the open of the 01:00AM EST bar, which I set up but forgot to use, using the open of the same bar instead. It works out much more profitable and in fact the bog standard First Strike using that documented rule doesn't even perform half as well.

HTML:
Performance	All Trades
Total Net Profit	$287220.00
Gross Profit	$1563380.00
Gross Loss	$-1276160.00
Commission	$0.00
Profit Factor	1.23
Cumulative Profit	$22504.04
Max. Drawdown	$-12248.64
Sharpe Ratio	0.12
	
Start Date	01/01/2001
End Date	31/12/2008
	
Total # of Trades	4098
Percent Profitable	33.14%
# of Winning Trades	1358
# of Losing Trades	2740
	
Average Trade	$70.09
Average Winning Trade	$1151.24
Average Losing Trade	$-465.75
Ratio avg. Win / avg. Loss	2.47
	
Max. conseq. Winners	3
Max. conseq. Losers	10
Largest Winning Trade	$15180.00
Largest Losing Trade	$-2040.00
	
# of Trades per Day	1.40
Avg. Time in Market	1.28 days
Avg. Bars in Trade	122.5
Profit per Month	$242.03
Max. Time to Recover	1183.48 days
	
Average MAE	$392.89
Average MFE	$859.37
Average ETD	$789.28

I also had to emulate the stop orders using market orders and checking each bar manually for the price going through the stop. NinjaTrader doesn't trust its customers to be able to use two opposing stop orders simultaneously.

I cheated as well. I checked the out-of-sample to make sure this system had similar results and is at least worth pushing on with. It is. Good.

Oh crap. I'm not doing my homework very well here. I just saw the largest winning trade. Somewhere in there I've left positions open for the whole data series. So scrub that result. Will have to look for my mistake tomorrow.

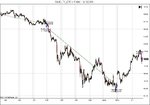
No wait - that's a real trade. In just one week - $15,000. Check the chart.
 

Attachments

  • $AUDJPY_DTC (15 Min)  14_10_2008.jpg
    $AUDJPY_DTC (15 Min) 14_10_2008.jpg
    82.9 KB · Views: 152
Last edited:
Things to do next.

(1) integrate some code into my NinjaTrader strategy to allow me to run a true portfolio analysis on the basket of currencies (thanks Dan).

(2) import data from this new source of FXCM data going back to 2001 (thanks Jason)

(3) try optimising the entry stops and exit stops on different forex pairs for First Strike

(4) have a look at a couple of tweaks for the Turning Points system, which got hammered this week. I can visualise what's going on much better when I see the targets and stops on the price chart, compared to just the finished trades - i.e. sitting looking at live positions really gets me thinking.
 
Gap Filler

Just putting together a system to trade the gaps on Sunday evenings from Friday night in the forex markets.

So far this is what I have - target is 90% of the gap, exit is at end of day Monday, from Jan to Mar inclusive 2010:

HTML:
Instrument	Total Net Profit	Average Trade	Total # of Trades
$AUDCAD/$AUDCAD	0.00	0.00	0
$AUDCHF/$AUDCHF	225.00	225.00	1
$AUDJPY/$AUDJPY	140.00	140.00	1
$AUDUSD/$AUDUSD	160.00	160.00	1
$CADCHF/$CADCHF	255.00	63.75	4
$CADJPY/$CADJPY	140.00	140.00	1
$CHFJPY/$CHFJPY	40.00	40.00	1
$EURAUD/$EURAUD	0.00	0.00	0
$EURCAD/$EURCAD	-750.00	-750.00	1
$EURCHF/$EURCHF	100.00	100.00	1
$EURGBP/$EURGBP	160.00	160.00	1
$EURJPY/$EURJPY	0.00	0.00	0
$EURUSD/$EURUSD	15.00	15.00	1
$GBPAUD/$GBPAUD	565.00	565.00	1
$GBPCAD/$GBPCAD	-990.00	-990.00	1
$GBPCHF/$GBPCHF	175.00	175.00	1
$GBPJPY/$GBPJPY	195.00	195.00	1
$GBPUSD/$GBPUSD	230.00	230.00	1
$USDCAD/$USDCAD	160.00	160.00	1
$USDCHF/$USDCHF	-345.00	-345.00	1
$USDJPY/$USDJPY	0.00	0.00	0
COMBINED RESULTS	475.00	23.75	20

The end-of-day trade exit if the gap isn't filled is a bit of a killer, to say the least.

I have to mull over the possible exit strategies.

- Dollar Stops. The obvious option, but obviously requires optimisation which I am developing a phobia for.

- Time Stops. What is the average amount of time it takes to fill a gap? I guess that's optimisation too.

Hmm. Looks like I could do either and I'll just grit my teeth and cross my fingers while doing the optimisation. And have a big out-of-sample test period.

The markets are always interesting when they open on Sunday evening. This time I made a grand on my positions - although considering I lost a grand on my positions between 21:45 and 22:00 on Friday night, I guess it's just a technicality.
 
Re: Gap Filler

Just putting together a system to trade the gaps on Sunday evenings from Friday night in the forex markets.

So far this is what I have - target is 90% of the gap, exit is at end of day Monday, from Jan to Mar inclusive 2010:

HTML:
Instrument	Total Net Profit	Average Trade	Total # of Trades
$AUDCAD/$AUDCAD	0.00	0.00	0
$AUDCHF/$AUDCHF	225.00	225.00	1
$AUDJPY/$AUDJPY	140.00	140.00	1
$AUDUSD/$AUDUSD	160.00	160.00	1
$CADCHF/$CADCHF	255.00	63.75	4
$CADJPY/$CADJPY	140.00	140.00	1
$CHFJPY/$CHFJPY	40.00	40.00	1
$EURAUD/$EURAUD	0.00	0.00	0
$EURCAD/$EURCAD	-750.00	-750.00	1
$EURCHF/$EURCHF	100.00	100.00	1
$EURGBP/$EURGBP	160.00	160.00	1
$EURJPY/$EURJPY	0.00	0.00	0
$EURUSD/$EURUSD	15.00	15.00	1
$GBPAUD/$GBPAUD	565.00	565.00	1
$GBPCAD/$GBPCAD	-990.00	-990.00	1
$GBPCHF/$GBPCHF	175.00	175.00	1
$GBPJPY/$GBPJPY	195.00	195.00	1
$GBPUSD/$GBPUSD	230.00	230.00	1
$USDCAD/$USDCAD	160.00	160.00	1
$USDCHF/$USDCHF	-345.00	-345.00	1
$USDJPY/$USDJPY	0.00	0.00	0
COMBINED RESULTS	475.00	23.75	20

The end-of-day trade exit if the gap isn't filled is a bit of a killer, to say the least.

I have to mull over the possible exit strategies.

- Dollar Stops. The obvious option, but obviously requires optimisation which I am developing a phobia for.

- Time Stops. What is the average amount of time it takes to fill a gap? I guess that's optimisation too.

Hmm. Looks like I could do either and I'll just grit my teeth and cross my fingers while doing the optimisation. And have a big out-of-sample test period.

The markets are always interesting when they open on Sunday evening. This time I made a grand on my positions - although considering I lost a grand on my positions between 21:45 and 22:00 on Friday night, I guess it's just a technicality.

Can you trade at 9pm on sunday? It actually works better if you trade at 9pm instead of 10pm and also stick to certain currency pairs like eurusd, audusd and gbpusd.
 
re: Gap Filler

meanreversion said:
www.amibroker.com

$280, do it, do it ..

I just looked at Amibroker again and I couldn't actually work out if it actually is an execution platform. It's documentation is a bit on the sparse side. It says it works with a variety of data providers but it doesn't state that these can be used to trade. Or am I missing something?

Anyway re GBP/AUD etc, have you guys traded these minor crosses? During normal trading on IB I get what I deem to be respectable spreads.

It remains to be seen if I can get any decent fills on the Sunday evening open!

I can't trade any earlier than 22:15 GMT+0 with IB.

However I can hook up a range of different brokers to NinjaTrader, e.g. MBT or FXCM, who open earlier. I'm not sure what their fills would be like though.
 
I use an eSignal feed into Amibroker, from which I place orders in Interactive Brokers using the Amibroker API,

So, you can control IB from Amibroker.. is this what you meant?
 
I use an eSignal feed into Amibroker, from which I place orders in Interactive Brokers using the Amibroker API,

So, you can control IB from Amibroker.. is this what you meant?

You "can control IB from Amibroker"? There is obviously some miscommunication going on here because that sounds like flying a model aeroplane.

With NinjaTrader, you have to configure the "Connection" set-up and once done, you can to all intents and purposes forget that you have IB running, for anything. Orders, trades, account equity, balances etc.. With one exception - the ludicrous forced shut-down that IB TWS has implanted in its heart.
 
Re: FirstStrike, and running a portfolio strategy in NinjaTrader

Thanks to drolles for pointing this out to me, but up until last week I had been under the impression that I couldn't do a proper portfolio analysis on a basket of instruments for any of my trading systems using NinjaTrader.

In fact actually it isn't a feature of NinjaTrader, surprisingly - portfolio analysis is one of the biggest omissions from their functionality list. NT7 doesn't show account-level max drawdown or Sharpe Ratio or other stats for a backtest over a basket of instruments.

However what you can do and what I've spent the last 2 days doing is to hard-code the portfolio of instruments into the strategy script, which is functionality presumably aimed at correlation or arbitrage traders. The end result of a backtest is the account-level stats combining all instruments. The downside is that it's a hassle to script and secondly, it doesn't show individual instruments' results.

For me, the major pain in scripting this right now is that I want to run the portfolio backtest on different datasets. I have IB data, with symbol $AUDUSD etc, Disktrading data which I imported with symbol $AUDUSD_DTC and FXCM data with symbol $AUDUSD_FXCM. So each time I want to run it on a different dataset I have to change the symbols in the script.

I am also struggling to do the comparison of the trade PnL between the list backtest and the portfolio strategy backtest, because the processing starts at different dates dependent on the data I have stored and without going into details, I haven't nailed down when the exact given start date must be to get them both to run on the same period. At least though I only have to do this comparison once to make sure I've scripted the portfolio strategy script correctly.

More later.
 
Re: Checklist for good systems - corollary to this: checklist for solving weird bugs

System Building Checklist v3

* tailor entries and exits to envisioned trade lengths, frequency, hit rate etc and don't faff with bells and whistles if your basic system is a turd
* Is unoptimised system profitable both long only and short only?
* Is unoptimised system profitable over 10 years?
* Is unoptimised system profitable on unseen periods long enough to be more than chance?
* Is the profit spread out across the period, i.e. is there a nice equity curve?
* Is max drawdown less than 50% of total profit?
* Is longest drawdown less than 18 months?
* Does it work unoptimised across all major pairs?
* Are there any stupidly profitable trades, i.e. >5 x bigger profit than avg?
* Are there any stupidly long trades, i.e. >5 x longer than avg duration?
* Are there any massive losses?

(1) Check the underlying data - are there any gaps in your history?
 
First Strike - adjusting the system part 1.

Here's the website for the system author, from the PDF

http://infiniteyieldforex.blogspot.com/

and

http://www.infiniteyield.com/

I have 3 variables for this system with the author's original settings given:

(1) hour to start at beginning of the week - 6:00AM GMT+0
(2) number of points for entry away from price at (1) - 50 points
(3) number of points for exit away from entry - 60 points

Now I'm varying those to see if I can optimise the system for more markets.

Another point: scripting with the 'managed' orders API in NinjaTrader, I can't submit a buy stop and a sell stop simultaneously, so it's easiest to fake it using 15min bars and checking at the end of the bar whether I should put on a position. There are ways of doing it with 'unmanaged' orders in NT7, but NT7 is not robust enough for me to trust that.

As I said in my first post above on First Strike, I wanted to standardise the stop distances to try to get an even stop distance that works OK on all currency pairs. I decided to use a standard unit of ATR composed from a weighted average of the hourly, daily and weekly ATRs:

1/3 * hourly
1/15 * daily
1/35 * weekly

That is loosely based on the current ATR values for GBP, the fractions giving 10 points.
 
Last edited:
Re-engineering First Strike to work on more than just the core forex pairs

Performance of First Strike on some pairs was terrible, so I looked at the trades on one of those - EUR/GBP - to see what was going on.

The chart shows a typical bad trade.

It seems the clever little weighted ATR I am using just doesn't cut it here. The Open of the 06:00 bar is the middle horizontal line - the vertical is 6:00AM. The stop entries should be way further apart than this.

The weightings of the ATR must be off for it to fall to this low level. I guess I need to ditch this weighted ATR idea and stick with fractions of the weekly ATR, which after all is what First Strike in essence aims to exploit.

PS a break-out on its own looks quite flakey as well. I think I'll have to try some simple trend filter as well to avoid getting blown out of the water by rogue spike.
 

Attachments

  • $EURGBP_DTC (15 Min)  04_09_2001.jpg
    $EURGBP_DTC (15 Min) 04_09_2001.jpg
    92.4 KB · Views: 259
Re: Gap Filler

Target is 90% of the gap, exit is at end of day Monday, from Jan to Mar inclusive 2010, changed to 1 mins bars - 15 mins bars was a waste of time since NinjaTrader backtesting was entered the trade not at the Open as I thought, but at the Open of the next bar. Bizarre.

New results:

HTML:
Instrument	Total Net Profit	Total # of Trades
$AUDCAD/$AUDCAD	-295.00	9
$AUDCHF/$AUDCHF	-200.00	6
$AUDJPY/$AUDJPY	-10.00	10
$AUDUSD/$AUDUSD	190.00	9
$CADCHF/$CADCHF	840.00	10
$CADJPY/$CADJPY	745.00	10
$CHFJPY/$CHFJPY	615.00	9
$EURAUD/$EURAUD	-245.00	10
$EURCAD/$EURCAD	275.00	8
$EURCHF/$EURCHF	335.00	7
$EURGBP/$EURGBP	-630.00	10
$EURJPY/$EURJPY	95.00	8
$EURUSD/$EURUSD	900.00	10
$GBPAUD/$GBPAUD	-160.00	9
$GBPCAD/$GBPCAD	-4360.00	10
$GBPCHF/$GBPCHF	-385.00	10
$GBPJPY/$GBPJPY	1410.00	9
$GBPUSD/$GBPUSD	-1050.00	9
$USDCAD/$USDCAD	910.00	9
$USDCHF/$USDCHF	400.00	9
$USDJPY/$USDJPY	690.00	9
COMBINED RESULTS	70.00	190

The system is really dumb at the moment - this is without proper stops, just the timed exit, so the risk/reward for some trades is ridiculous - it might just be a five tick gap, but it puts on a position and it can run in the wrong direction all day.

So I do need to optimise the stop. Something like a multiple of the hourly ATR.

Hey Adam.

Can you explain the gap trade to me? Or your version of it.

Brett
 
Re: Gap Filler

Hey Adam.

Can you explain the gap trade to me? Or your version of it.

Brett

Hi Brett

it's really simple! Goes to show how convoluted my journal entries must be if you can't figure out what I'm on about.

It really is just about putting on a position at the end of the weekend when the market opens with a gap from the Friday close.

The technical details are laid down by my broker, IB: they stop sending price data at 22:00 GMT+0 on Friday, and recommence at 22:15 GMT+0 on Sunday.

I assume there is only one definition of a gap: clear space between the top or bottom of the previous bar and the new open.

Since I'm trading it mechanically (21 forex pairs - try doing that manually) I have to code it and it's not straight forward to code it for backtesting. I could code it with tick data from Disktrading, but I want to test it on the Interactive Brokers data which is closest to the live feed it will trade - and I don't have tick data for that.

I only have minute data.

While writing this it occurs to me that I should just ask NinjaTrader support straight out how best to code a market order to fire off when the open is above or below a certain price. I just think NinjaTrader won't let me do that.

It also occurs to me that backtesting with 1 minute data will mean all my entries will be 1 minute after the open. I guess I can compare the results on 1 minute data with the same data set to tick resolution and find out what difference it makes. Maybe it all works out the same.
 
re: Gap Filler - optimisation problem

Here's the optimisation results for the period 2001-2008 on GBP/USD using 1 min bars:

HTML:
Instrument	Net Prof	Avg Trd	Max. DD	Trds	%Wins	Profit/DD
$GBPUSD_DTC	4080.00	12.79	-2965.00	319	68.0%	1.38
$GBPUSD_DTC	8130.00	25.49	-3980.00	319	79.6%	2.04
$GBPUSD_DTC	10850.00	34.01	-5390.00	319	85.3%	2.01
$GBPUSD_DTC	12825.00	40.20	-7355.00	319	88.4%	1.74
$GBPUSD_DTC	10720.00	33.61	-9620.00	319	89.3%	1.11

Hopefully the table will appear legible.

The five results are using different multiples of the 15min ATR as the stop. Row 1 uses a stop placed 1 15min ATR away from the entry, row 5 uses a stop 5 ATRs away.

If I optimise purely on profit, I would choose row 4 with $40 per trade, which would cover commissions and slippage nicely. However look at the equity curve below for it - there's a steep drop in profitability at the end of the test period (that would be thanks to the volatility from the credit crunch crisis).

So if I optimised on profit over drawdown, the last column, I would choose row 2 - but the profit per trade is only $25, which is barely enough to cover commissions and slippage.

Do I compromise and choose row 3?

If I trade it in a basket with other instruments, do I ignore the individual results and just check to see which setting enhances the portfolio more? Hmm. Maybe it's time to read that chapter in the Mathematics of Money Management on portfolio optimisation.
 

Attachments

  • Row2.jpg
    Row2.jpg
    22.1 KB · Views: 186
  • Row3.jpg
    Row3.jpg
    20.9 KB · Views: 174
  • Row4.jpg
    Row4.jpg
    20.8 KB · Views: 186
Top