You are using an out of date browser. It may not display this or other websites correctly.
You should upgrade or use an alternative browser.
You should upgrade or use an alternative browser.
DionysusToast
Legendary member
- Messages
- 5,965
- Likes
- 1,501
Interesting stuff - keep it up !
Adamus
Experienced member
- Messages
- 1,898
- Likes
- 97
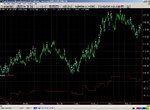
Third optimisation window and walkforward
Third optimisation window:

and the walkforward of the same system:

:clover:
So now I move the windows on by six months and my next optimisation window is
2007-01-01 2008-12-31
Next walkforward
2009-01-01 2009-06-30
My gut feeling is the walkforward will be another loss. It seems to be 50/50 chance. I'll have to do a lot of these optimisation / walkforward analyses to convince myself.
One question is: should I go for a slight change in the system parameters from the previous optimisation, if that's all I need to do to get a decent looking equity curve, or should I hunt around more?
I've got quite a few statistics to judge the optimisation results by, the question is which ones are best?
Third optimisation window:
and the walkforward of the same system:
:clover:
So now I move the windows on by six months and my next optimisation window is
2007-01-01 2008-12-31
Next walkforward
2009-01-01 2009-06-30
My gut feeling is the walkforward will be another loss. It seems to be 50/50 chance. I'll have to do a lot of these optimisation / walkforward analyses to convince myself.
One question is: should I go for a slight change in the system parameters from the previous optimisation, if that's all I need to do to get a decent looking equity curve, or should I hunt around more?
I've got quite a few statistics to judge the optimisation results by, the question is which ones are best?
Last edited:
Adamus
Experienced member
- Messages
- 1,898
- Likes
- 97
I see a couple of explanations for this failure.
(1) I applied such whacky algorithms there was no way they were going to work out of sample
(2) a phase of market action happened in the last 4 months of the walk-forward that had never appeared in the optimisation window.
(3) 6 months is too long for a walk-forward - I should stick to 3 months (would have been nice). Pardo wrote his book in the early 90's, things have probably got more challenging since then.
(4) I have too many different components in the algorithm. It's a break-out system, so I have (a) a mid-point finder (b) a range finder for the limits either side of the mid-point (c) a filter (d) a stop distance calculator. Perhaps optimising against all of those is too much curve-fitting.
So what can a trader do?
(1) reduce the walk-forward window to 3 months. This probably reduces the chances of 'unseen' market types cropping up. It is probably more likely that the current market behaviour at the end of the optimisation window will continue through the walk-forward.
(2) stop optimising one or two of the algorithm components - i.e. lock down the stops to 2 times the average true range - or stick with one filter
Last edited:
Adamus
Experienced member
- Messages
- 1,898
- Likes
- 97
OK, I'm going to ditch the whacky algorithm components and stick to bog standard ATRs and I'm also going to go with 3 month walk-forwards instead of 6 month.
So for my next trick I will be optimising on the bund from 2007-07-01 to 2009-06-30 and the walk-forward will be 2009-07-01 to 2009-09-30.
So for my next trick I will be optimising on the bund from 2007-07-01 to 2009-06-30 and the walk-forward will be 2009-07-01 to 2009-09-30.
Adamus
Experienced member
- Messages
- 1,898
- Likes
- 97
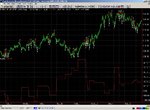
walkforward failed
Decided to go with this system based mainly on the nice equity curve.

The walkforward was bad:

At this point I threw in the towel - although looking back over the stats, I realise I was wrong to have chosen it in the first place.
Total Profit €12700
Gross Profit €33300
Gross Loss €-20500
Total Trades 52
# Wins 29
# Losses 23
Avg Trd (& Cost) €245 (24)
Avg Winning Trade €1150
Avg Losing Trade €-893
% Wins 56%
Largest Win €4010
Largest Loss €-1930
and just in case you can't see from the equity curve clearly, that optimisation I chose had a max drawdown at 2008-03-25 of €-4645 lasting 244 days, plus it didn't have 60 or more trades (30 per year is my minimum). So back to the drawing board for this period.
Decided to go with this system based mainly on the nice equity curve.
The walkforward was bad:
At this point I threw in the towel - although looking back over the stats, I realise I was wrong to have chosen it in the first place.
Total Profit €12700
Gross Profit €33300
Gross Loss €-20500
Total Trades 52
# Wins 29
# Losses 23
Avg Trd (& Cost) €245 (24)
Avg Winning Trade €1150
Avg Losing Trade €-893
% Wins 56%
Largest Win €4010
Largest Loss €-1930
and just in case you can't see from the equity curve clearly, that optimisation I chose had a max drawdown at 2008-03-25 of €-4645 lasting 244 days, plus it didn't have 60 or more trades (30 per year is my minimum). So back to the drawing board for this period.
Last edited:
Adamus
Experienced member
- Messages
- 1,898
- Likes
- 97
My rules so far for identifying an optimisation that has a realistic chance of being profitable in the walk-forward:
(1) equity curve has to look good, i.e. no drawdowns for longer than 6 months and no drawdowns bigger than (fill in the blank ..... I'll have to work this one out but I guess it's a percentage of the final profit).
(2) more than 60 trades a year (I'm only doing optimisation windows of 2 years, so with daily bars, that's only 500 bars.)
(3) no pooftas
Adamus
Experienced member
- Messages
- 1,898
- Likes
- 97
ain't so simple
60 trades in 500 bars is over 10% of days. Hmm.
As far as the rules are concerned for 2007-07-01 to 2009-06-30, I can't find an optimisation that works.
Another rule I forgot to mention:
(4) the system should make a profit both long and short. For instance a two year optimisation window where the price trends upwards the whole time might show great results for anything that goes long, but have poor results for down-trends. So if I chose that optimisation and the market promptly stopped trending upwards, my walk-forward (or worse, live trading) would be doomed.
Rule (5): if you don't find an optimisation that fits the rules, don't trade it. This rule is a mind-blower. I found so many optimisations for 2007-07-01 to 2009-06-30 in the bund, but they were all slightly outside the rules. The only way I could be satisfied though that I couldn't trade those optimisation though was by looking at the walk-forwards. They all lost. So if I am optimising for actual live trading, am I going to trade the optimisation just to see what happens? To see if my rules were correct? Hmm. 😳
My rules so far for identifying an optimisation that has a realistic chance of being profitable in the walk-forward:
.....
(2) more than 60 trades a year (I'm only doing optimisation windows of 2 years, so with daily bars, that's only 500 bars.)
...
60 trades in 500 bars is over 10% of days. Hmm.
As far as the rules are concerned for 2007-07-01 to 2009-06-30, I can't find an optimisation that works.
Another rule I forgot to mention:
(4) the system should make a profit both long and short. For instance a two year optimisation window where the price trends upwards the whole time might show great results for anything that goes long, but have poor results for down-trends. So if I chose that optimisation and the market promptly stopped trending upwards, my walk-forward (or worse, live trading) would be doomed.
Rule (5): if you don't find an optimisation that fits the rules, don't trade it. This rule is a mind-blower. I found so many optimisations for 2007-07-01 to 2009-06-30 in the bund, but they were all slightly outside the rules. The only way I could be satisfied though that I couldn't trade those optimisation though was by looking at the walk-forwards. They all lost. So if I am optimising for actual live trading, am I going to trade the optimisation just to see what happens? To see if my rules were correct? Hmm. 😳
Adamus
Experienced member
- Messages
- 1,898
- Likes
- 97
Two charts showing trades and equity, one is long, one is short. This is the long uptrend I was complaining about in the previous post. Doesn't look very long now admittedly but I reckon it foobar'd my chances of finding a decent optimisation with this trading system.
Next optimisation window will also contain the same big uptrend 🙁 :
2007-10-01 to 2009-09-30
Walk-forward window:
2009-10-01 to 2009-12-31
Next optimisation window will also contain the same big uptrend 🙁 :
2007-10-01 to 2009-09-30
Walk-forward window:
2009-10-01 to 2009-12-31
Attachments
Last edited:
A Dashing Blade
Experienced member
- Messages
- 1,373
- Likes
- 171
Chucking in a couple of ideas . . . .
Don't trade over big econ number days (NFP etc in the US, sectiment indicator in Germany)
Make you trades at mid-day rather than at close (ie 21.00 London time) as you can often get very nasty squeezes on very thin volumes.
Don't trade over big econ number days (NFP etc in the US, sectiment indicator in Germany)
Make you trades at mid-day rather than at close (ie 21.00 London time) as you can often get very nasty squeezes on very thin volumes.
Adamus
Experienced member
- Messages
- 1,898
- Likes
- 97
Thanks but I can't program that in - well I could just not trade those days - but using a break-out system with trailing stops, I need to put the trades in before the open.
Interesting that you advise not to trade at the close. One of my algorithms that I haven't put into action relies on exiting 5 mins before the close. I assumed that the slippage would be worse than normal, but I'm not worried about the price - that should be included in the price history already.
Or are you talking about price spikes that take out stops?
Adamus
Experienced member
- Messages
- 1,898
- Likes
- 97
I'm going to change my rule (3) which was pretty facile and not much use :jester:
New Rule (3): % profitable trades of total trades should be at least 40. Maybe 35%.
I should make a rule (6) about the profit required. Maybe £5K p.a.
I'll have to revise those as I get more experience with this optimise/walk-forward method.
13 weeks 6 days left.
New Rule (3): % profitable trades of total trades should be at least 40. Maybe 35%.
I should make a rule (6) about the profit required. Maybe £5K p.a.
I'll have to revise those as I get more experience with this optimise/walk-forward method.
13 weeks 6 days left.
Adamus
Experienced member
- Messages
- 1,898
- Likes
- 97
bad news on the latest walk-forward
This isn't looking good. 😢
After diligently applying my new set of rules to identify an optimisation with a decent equity curve, I got shafted by the walk-forward:

What a desirable looking equity curve, oh yes 😍
And then this:

😱
The stuff I'm putting into my algorithm must be too much. It must be curve-fitted. The stats from 6 optimisations look like this:
2 profitable walk-forwards, one abandoned and 3 loss-making.
Those are not odds I'd be happy trading.
This isn't looking good. 😢
After diligently applying my new set of rules to identify an optimisation with a decent equity curve, I got shafted by the walk-forward:
What a desirable looking equity curve, oh yes 😍
And then this:
😱
The stuff I'm putting into my algorithm must be too much. It must be curve-fitted. The stats from 6 optimisations look like this:
2 profitable walk-forwards, one abandoned and 3 loss-making.
Those are not odds I'd be happy trading.
Adamus
Experienced member
- Messages
- 1,898
- Likes
- 97
Deadline June still stands
I figure the curve-fitting comes from using 2 filters instead of just the one.
I've have an arsenal of code for about half a dozen basic measures of market action, for instance ATR, DMI, CCI and a few I cobbled together like one I call 'CloseZone' which is just the smaller of the distance from the high to the close or the low to the close, doubled.
I try them as simple on/off filters to prevent / allow trading, they're either high or low (relative to a longer MA of the same), up or down (higher or lower MA compared to yesterday), and either rising or falling (compared to the longer MA again).
So I've got about 36 options to chose from on the filter front, and I guess combining 2 filters just curve fits the whole algorithm.
I was naively hoping 😱 to have a system to trade for the Bund by this weekend but that little project target has been blown out of the water.
I curve fitted my way through all my historical data for the Bund, well the last 8 years of it, and I don't have an algorithm.
I've got a simple choice here I think:
(A) chuck out my algorithm as I can't find a profitable system unless I curve fit, and try to find some other style of algorithm to work with
(B) make the algorithm simpler by disallowing more than one filter and deleting any other extraneous code switches in there which don't really look good. This will mean I can't find decent optimisations for more and more of the optimisation windows I look at, leading to more abandoned optimisation windows.
i.e. either choice = more work, gobbling up days to my deadline.
Plus I think I should move onto a different market and not run my next optimisations over the same data.
Adamus
Experienced member
- Messages
- 1,898
- Likes
- 97
Curve-fitting
A question occurred to me: I wonder if there is a direct correlation between degree of curve fitting and amount of data in the optimisation.
It seems pretty obvious that it's dead easy to curve fit 6 months of historical data, or in my case 2 years 😱
What if I analysed 15 years worth of data across 25 futures and forex markets?
My gut reaction is no, it won't be curve fit, not if I use what I'm currently using, which is relatively simple. But I'm not answering my question there.
So I guess I need another axis on my graph of curve fitting against amount of data: z-axis - complexity of optimised program. :|
Adamus
Experienced member
- Messages
- 1,898
- Likes
- 97
navel gazing and automated serial correlation arbitrage
Amazing how I can kid myself that I am working when I'm sitting around staring at my navel :cheesy: - need a proper emoticon for that.
So who cares what the 3D graph of curve-fitting against historical data sample size against program complexity looks like - I certainly shouldn't.
On another note, just realised that I misnamed my activities as 'algorithm trading' when I should be calling it program trading, or automated serial correlation arbitrage.
Algorithm trading seems to be an ill defined term that can include various other types of trading or just order execution.
I just used 'algorithm trader' since it seemed a suitable term to differentiate my technique from the traders out there reading charts and entering orders manually.
I'm going to take a break. Here's a recycled humorous photo to break up the dull text of this journal, instead of a mickey mouse 3D excell chart.
Attachments

DionysusToast
Legendary member
- Messages
- 5,965
- Likes
- 1,501
Although your approach to optimisation seems sensible, it is in fact not the best way to go about it.
The most obvious thing to do is use a large range and set your parameters for that range. It is the most obvious but it is not the best way. All it will do is give you curve fitted results.
Better would be to optimize (if you really have to) over a small date range and then once you have the parameters you need, then run the system over a different date range pick lots of date ranges to cover different market conditions and see if your settings survive. You will quickly see if you have a system curve fitted for the range you optimized. This is a subtle but important difference.
Another issue you have to be watchful of is the impact of a change in a parameter. Let's say you use a percentage change in your system. Let's also say that the percentage change setting of 12% gives you 75% profitable trades. If changing the setting to 11% then gives you 40% profitable trades, you are more than likely looking at curve fitting. A small change in the parameter giving a huge change in results should ring alarm bells.
Similar threads
- Replies
- 2
- Views
- 3K