DAX - Neural Network System

doh

Junior member
Messages
26
Likes
4
I found it very educational to see what a neural net will create as a viable trading system. If you want to trade this system you need big stops - 10%. I think anyone who has been in this game long enough knows that stops reduce win% - but allow greater leverage - so it's a trade-off. You could use 5% stops but profit factor will reduce - although greater leverage will mean greater profits.
Anyway I'm having some success with this model (75% winning trades and PF of 4!) and so I will post the trades (I personally use very low leverage and 10% stops). These trades can last anywhere between 2 days and three months.

Today a signal was generated to go short at the DAX close - entered at 6576.

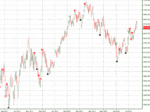
The previous trade made 444 points (diagram below)

DAX.gif
 
Last edited:
Since these trades can last several months (although typically a couple of weeks) a weekend update might be useful.
Current status: 6/7/12 at 6410. 166 point gain on short position still open.
 
Last edited:
Hi, is this a neural network you developed or are you part of a trading firm ?
 
No, I'm just a retired guy with time on my hands and have been looking at this for several years - so I know all the traps (most of them anyway). I'm probably over-cautious, but the nets have given me a 50% return this year so far - but who knows what tomorrow will bring.
 
Sounds perfect so far. I have a manual trade setup which has a large stop and appears to give consistent results with low leverage. So I reckon you're on to a winner too with your stats so far.
I'd be ineterested to see how well it does for you over the summer months as low volume volatility is my main concern with these trades.

Neither the in-sample or out-of sample or real trading periods show any diminishing of performance over the third quarter (July - Sept) - but I'm probably just setting myself up for a dreadful summer. We shall see.
 
Short trade exited at 6396. 180 point gain
 
Last edited:
what is the time frame that the NN works too? if it's intraday, can you teach it to recognise a reversla candle pattern ?
 
what is the time frame that the NN works too? if it's intraday, can you teach it to recognise a reversla candle pattern ?

I use daily timeframes simply because I've found that this is the most successful timeframe. The reason for the large stops is that the NN is very poor at predicting turning points, but fairly good at getting it right eventually. I've tried all sort of candle patterns and had no success - but that is probably just me. The NNs I have built rely on over 150 indicators I have built - all variations on a theme, and any particular NN uses a max of 3. I should add that somewhat unusually these indicators are parameterless - so they either work or they don't - the chances of curve fitting are much reduced.
 
I see, I also use Daily Time Frames down to H4.
Can you teach the NN to recognise Inside Bars ? or maybe just to recognise a Doji? If it's possible to teach the NN a candlestick pattern as simple as those, could you not teach it to then recognise an overbought or oversold condition on a stoch?
I get the feeling that the Human brain is always going to be best for pattern recognition but I am interested to see how much the NN's can learn as my patterns are few, maybe 12 different types of Doji's, Extreme conditions on a Stoch and closing above a short EMA.
I get the point of Curve Fitting as when I back test I try to keep everything quite simple and short, then forward test to see if it still produces favourable results. I certainly wouldn't be looking to over optomise. I find the whole NN facinating but find it hard to find where to start learning the programming side of things.

I use Neuroshell, Peltarion and Tradecision - all fairly expensive I'm afraid. The problem with NNs is that they will curve fit almost anything - you could thrown in next weeks weather forecast and they'd make something of it. But of course the out-of-sample (foreward test) would look like a car crash.
You've got me thinking on the candles - I may have another look, although NNs work best with continuous functions such as MAs and RSI - in my experience anyway.
I should add that to trade the DAX NN (or any NN) means foresaking common sense to some extent. I would never have gone short the DAX right now cos it seems to have just completed a reverse H&S. So I've a feeling this may be a losing trade - but if you believe in your system you stick to it through fair and foul.
 
"High Profit Trades found with Candlestick Breakout Patterns" - Stephen Bigalow - YouTube not saying that this is a perfect strategy but it is simple and obviously the basis of a ot of winning strats is Price Action.
The close either side of the 8 ema is a good guide that a daily trend could be changing, the stochastic although I am not a major fan of this indicator does give a visual hint that the price is oversold/bought and maybe could be taken into consideration, though I think the chart patterns and an 8 ema would be enough for a NN. Once it learned the pattens it's just a case of execution on a ema and the rest is money management.

Thanks for the link - I have Bigalow's books too - along with a hundred others. This is discretionary trading - at which I'm totally hopeless, and the reason I persisted so long with the NNs. System trading is the only way forward for me since it takes the emotion out of it and having to decipher a hundred contradictory factors. However I will have a look at his ideas for a NN - I'll let you know.
 
Good luck with it all.
I'm considering going back and getting the algebra up to a decent level but I fear that the maths and coding would be a leap too far. NN would appear to be the future but trading simple set ups I think is key. BWTFDIK I'm just starting to get how to do it myself let alone getting a computer to thinl for me :)
 
Current Trade

The current trade has been quite a ride so far - price moved around 5% against me. But FTSE and SP long trades have just shown an exit (no shorts though) and so hopefully the DAX will head toward my entry.
 
Could you post another chart ?

Chart below as requested. Latest trade went deep into drawdown - but is in profit as I post this (hence the big stops).
I should add that there are some small changes when compared with the first chart cos I've changed the stop level to 6% - but broadly it is the same.
 

Attachments

  • Dax1207web.gif
    Dax1207web.gif
    19.5 KB · Views: 245
Last edited:
Top