First few steps ...
Hi Everyone.......
heres more thoughts re using the indicator I posted....simple stuff but has potential
set the correlator up on 1min or 5min TF's or both !
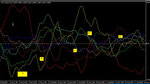
set Ma to 200and the Delta to 1.......you are now seeing virtually real time trading with no secondary MA lags between the currencies with crossovers occurring at roughly the 200mas for all currency pairs involved (yes - I like the 200ma !)
then just follow the movements of favouite Currencies looking for breakout and retrace opportunities............also add o/b o/s lines in of you want to anticipate turns in currencies (per attached).I have left the GBP, Euro,Yen and USD on this example as I like those (no offence to the aussie pairs,Swisse or Loonie !) + dropped in o/b and o/s linea at -0.00010 and +0.00010 (by eyeballing the history)
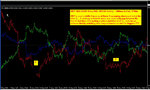
the first arrow on the left below in chart is a classic !....the Yen was overbought (tooo high) and is coming back down....on retrace then continuation of the fall sell it and buy a reciprocating currency you see (or just a basic one that usually moves against the Yen)....Euro or GBP would have provided a lovely foil to this fast trading opportunity....as far as the other arrows, I am just trying to show where trending is starting to move nicely and you could trade on the continued break throughs......
please play with it if you get time and time me give me feedback here..........
Neil
I have been experimenting with the setting a bit Neil, and it is surprising how quickly this stuff rubs off on you.
Already I am learning which Colours = which Currency. You just have to use them a bit.
And I have worked out 2 ways to highlight the pairs I have filtered visually as having trading potential:
1) Just select the Correlator from the chart window by right clicking on it, and change the three you are looking at to a thickness of 3
2) Or instead of changing thickness - just change the colours of all other currencies to "NONE"
This will temproarily erase the unwanted ones, leaving a clear comparison of the remaning ones.
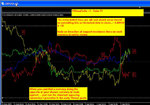
eg on the 5 min chart I have noticed the GBP has crossed the JPY, so that the JPY is above the zero line, and the BP below. So I picked which of the EUR and USD are closest to the zero, and also retained that (the EUR is sitting very close to and parallel to the zero right now). The rest I eliminated.
So It looks to me that the GBP and JPY have moved away from the zero, and at some point they "should return ... at least relative to each other, any movement will appear that way on your correlator - or should I say "our" correlator now, since you have shared it so generously with us
🙂🙂
To profit from this, we could sell the EURJPY and buy the EURGBP.
Is this something you had in mind?
It seems to me that this is an edge.
I found the same thing with the AUD and the USD using EUR as common denominator.
Now - If these things trend away from the mean (zero) for extended periods of time ... we could end up with a serious drawdown ... potentially destructive to an account. This needs to be adressed - using a stop-loss, or position size limit, so we can avoid that dreaded grim reaper, the Margin Caller!
Another way to avoid this, would be to impose a time limit.
Thirdly, it may prove expedient to set a target for the trade - eg close out at 30 pips profit. Choosing an arbitrary number of pips for profit-taking may be robbing ourselves in some cases, because certain currencies are more volatile than others, and we may miss the best moves.
Hmmm. There is a lot of work to do here.
One of the things I would like to iron out ... what is the best Delta Setting for each TF? The 5 min TF may work best with a short Delta, say 3, but the longer ones, like 30 mins may be best served with a 10 Delta.
What are your thoughts on this?