Ingot54
Well-known member
- Messages
- 403
- Likes
- 62
Housekeeping for Correlation Trading
Vegemite is the Oz version of crack cocaine! It's loaded with the B-Group vitamins - rocket fuel on bread!
Anyway - before I ht the sack for the night it's after 1am here ...
There are a couple of things I would like to throw into the ring:
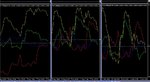
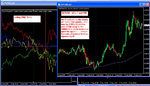
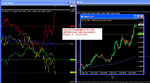
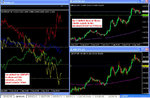
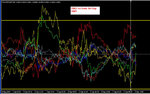
1) What favourite indicators do people use, which may have a role in this kind of trading, if any? I believe that eventually traders of this will not need any indicator other than the FXCorrelator. Personally I like to use the 5.3.3 Stochastic. After trying the MTF stochastic experimentally (see attached chart) I decided it was not appropriate for this kind of trading, and opted for the simple stochastic.
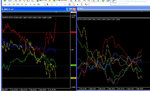
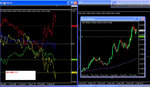
As mentioned in post # 79 I use the MTF (Multi Time Frame) ADX indicator as well. This indy will show you the trend on any TF of the particular pair you are trading, so you can instantly see the trend on the other TF without flicking over and back from differing TF charts.
2) What role would Support and Resistance play in this trading method? I can see that it is easily possible to trade without using them, because the FXCorrelator on the lower TF shows any divergence quite quickly, and traders could take their cue from that. But I was thinking more along the lines of knowing where a trend would be most likely to strike a snag, and be prepared to hit the "CLOSE TRADE " button at the first sign a trade was low on petrol!
3) Are there any other things that readers are unclear about right now?
I have been going back over earlier posts, and surprisingly I am finding some of my questions are already answered in the things Neil has said. At the time he posted, I simply was not open to understand the meaning, but it is clearer now because of the background we now have.
I suggest readers with an interest might gain much through re-reading some of the earlier posts. And please ... put your hand up to ask, or simply jump in to demo trading, and have a go - I think a lot of traders would be pleased to throw away all the collective indicators and garbage they have accumulated over the years ... that is my reacton to what I am finding.
If it works, why trade anything else? This is the first time I have found anything as easy ... and fun ... in trading the FX markets.
Best wishes
Ivan
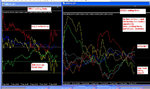
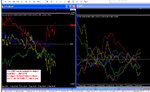
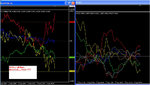
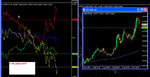
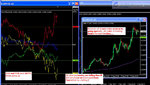
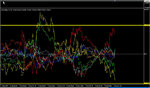
Here is one of my earlier charts ... one correction - the chart annotation says "10 EMA" is should read: "10 SMA". half of the indies on that chart no longer need to be seen. The FXCorrelator can be on its own chart, and all I need are simple 5.3.3 stochastic and the MTF ADX (trend) indicator. This leaves heaps of screen real-estate for price action.
Ingot54.......you wont understand this comment
its a famous one from a UK insurance commercial uttered by the colourful producer Michael Winner ! ..a kind of catch phrase !
GBPJPY
anyway I can 100% confirm you will need plenty of Vegemite flavoured Valium if you sit on this gunpowder pair......always remember you can calm it a little by going
Yen/Euro
or
GBP/USD
to introduce a lower Volatility currency to the trade (Yen/Euro is nice as I like the Yen more than any other Currency in the Family and it will slice through the Euro on its retrace without the whipsaw you may will get on GBP/Yen combo)
as for faster MA's...........ai yi yi !
Great Stuff and thanks for believing......!
Neil
Vegemite is the Oz version of crack cocaine! It's loaded with the B-Group vitamins - rocket fuel on bread!
Anyway - before I ht the sack for the night it's after 1am here ...
There are a couple of things I would like to throw into the ring:
1) What favourite indicators do people use, which may have a role in this kind of trading, if any? I believe that eventually traders of this will not need any indicator other than the FXCorrelator. Personally I like to use the 5.3.3 Stochastic. After trying the MTF stochastic experimentally (see attached chart) I decided it was not appropriate for this kind of trading, and opted for the simple stochastic.
As mentioned in post # 79 I use the MTF (Multi Time Frame) ADX indicator as well. This indy will show you the trend on any TF of the particular pair you are trading, so you can instantly see the trend on the other TF without flicking over and back from differing TF charts.
2) What role would Support and Resistance play in this trading method? I can see that it is easily possible to trade without using them, because the FXCorrelator on the lower TF shows any divergence quite quickly, and traders could take their cue from that. But I was thinking more along the lines of knowing where a trend would be most likely to strike a snag, and be prepared to hit the "CLOSE TRADE " button at the first sign a trade was low on petrol!
3) Are there any other things that readers are unclear about right now?
I have been going back over earlier posts, and surprisingly I am finding some of my questions are already answered in the things Neil has said. At the time he posted, I simply was not open to understand the meaning, but it is clearer now because of the background we now have.
I suggest readers with an interest might gain much through re-reading some of the earlier posts. And please ... put your hand up to ask, or simply jump in to demo trading, and have a go - I think a lot of traders would be pleased to throw away all the collective indicators and garbage they have accumulated over the years ... that is my reacton to what I am finding.
If it works, why trade anything else? This is the first time I have found anything as easy ... and fun ... in trading the FX markets.
Best wishes
Ivan
Here is one of my earlier charts ... one correction - the chart annotation says "10 EMA" is should read: "10 SMA". half of the indies on that chart no longer need to be seen. The FXCorrelator can be on its own chart, and all I need are simple 5.3.3 stochastic and the MTF ADX (trend) indicator. This leaves heaps of screen real-estate for price action.