You are using an out of date browser. It may not display this or other websites correctly.
You should upgrade or use an alternative browser.
You should upgrade or use an alternative browser.
Best Thread Correlation Trading - Basic Ideas and Strategies
NVP
Guest Author
- Messages
- 37,968
- Likes
- 2,158
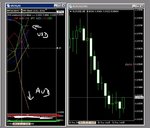
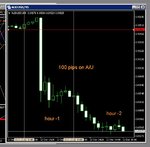
jees such a shame I was busy earlier
A/U was 100 pips in last 2 hours ...........even if I had bagged half of them thats a good days scalping
hour -2 would have been a reaction trade though as god knows what happened re AUD.....it wasnt business hours was it ?
N
A/U was 100 pips in last 2 hours ...........even if I had bagged half of them thats a good days scalping
hour -2 would have been a reaction trade though as god knows what happened re AUD.....it wasnt business hours was it ?
N
Attachments
Last edited:
NVP
Guest Author
- Messages
- 37,968
- Likes
- 2,158
ok I have to go to a meeting ....
if I was able to trade/scalp today I would now be on USDCAD at this moment
USD has some serious bull legs on it at the moment ....nice !
N
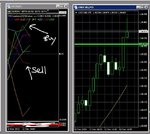
hey all
just feeding back yesterday ......that scalp offered up to the 7-10 pips most people hunt on scalps 👍
sure you see a lot of stuff here i post seems successful ........but thats just years of practice and a keeping an eye on a few other things that are more customised to my own particular style and preferences ...
so i've paid my dues to be in this place.... and you must to if you want to make money trading consistently and for the long haul.... ....no short cuts unfortunately.......sorry to tell you that !! 😢
and sure I DO have a lot of losing trades in the mix ......who doesnt ? 😉
This is a real world thread here .....not a system vendors imagination 🙄
N
Attachments
Last edited:
NVP
Guest Author
- Messages
- 37,968
- Likes
- 2,158
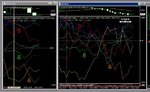
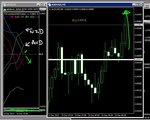
heres the week
left is daily , right is 4hr on a BASIC 20ma FXCorrelator
the name of the game is divergence......always ......we came in on the white vertical bar (left daily chart).....so we are hunting currencies that DIVERGE off of the starting block
Green USD Held a steady slow buring Sell signal..and the red GBP provided the early action with a nice move north....
then in truth we struggled a bit...until the gold AUD finally went south and stole the show.........Technically we would have looked to an above Zero Currency to buy against it ...........but remember ALWAYS...if in doubt use the USD .......
WHY ?...........because generally it tends to move relatively slowly and solidly ......so other currencies with more aggressive momentum will normally generate you pips
also see the 5 pips scale on the right chart ?.......take a look on that 4hr chart ............if a currency crosses the Zero and holds for 5 or more bars .......you are pretty guaranteed to make money 😎
AND REMEMBER
you dont need megatronic, analogised , synthetic hypersensitised EA's with hedge fund 48 currency weighted software...........forget it unless you like playing with that sort of stuff ..........The FXCorrelator is RAW and REAL ...:smart:
learn to use it and it will never fail you in interpreting the G8 market dynamics ...........👍
N
Attachments
Last edited:
keep it coming NVP....good stuff.
just some rambling thoughts if i may....
Sometimes it looks at the indy and see a divergence, then goto the actual pair chart to look for a trade and see it looks like a "late entry" on the PA....e.g. The best time to enter has already gone.
There is nothing in indy to suggest that the current direction/s of the pair will not change at any moment - the indy tells us "what is happening and what has happened" - e.g it is as laggy as a MA.
What i'm trying to say is this thread looks at trades going away from the 0 (i think...heheh), but why not trade on them snapping back to the 0, as this is surely what will happen (e.g the 0 or MA we could call it, is like an elastic band).
m
Last edited:
NVP
Guest Author
- Messages
- 37,968
- Likes
- 2,158
ok gotta scoot
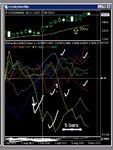
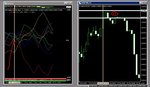
here the Year on the monthly charts 20ma
again ........can you see the crossover .....5 bar players ?
theres a few fallers ...but about 6 trades there by riding the crossovers are possible
and if you have taken yen sells from Q4 last year you should still be in some trades .....
simple ?........yes
follows the markets natural momentum .......yes
always win ?.........no
Will i use it ?............up to you !!! :smart:
later - duty calls
N
Attachments
Last edited:
NVP
Guest Author
- Messages
- 37,968
- Likes
- 2,158
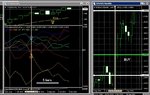
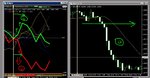
not to obvious on the 20ma chart previous...but the E/A has produced the most pips in the year to date ............about 2,700 on that pair since 1st jan 2013 😱
the FXCorrelator on a 20ma monthly TF setting signalled EURO buys from late 2012 (did it fall below the zero in 2013? ) and then AUD sell came good finally in may 2013 👍
about 1800 pips to date and still counting .............not bad ....i'll take that thanks :smart:
N
the FXCorrelator on a 20ma monthly TF setting signalled EURO buys from late 2012 (did it fall below the zero in 2013? ) and then AUD sell came good finally in may 2013 👍
about 1800 pips to date and still counting .............not bad ....i'll take that thanks :smart:
N
Attachments
NVP
Guest Author
- Messages
- 37,968
- Likes
- 2,158
keep it coming NVP....good stuff.
just some talmbing thoughts if i may....
Sometimes i looks at the indy and see a divergence, then goto the actual pair chart to look for a trade and see it looks like a "late entry" on the PA....e.g. The best time to enter has already gone.
There is nothing in indy to suggest that the current direction/s of the pair will not change at any moment - the indy tells us "what is happening and what has happened" - e.g it is as laggy as a MA.
What i'm trying to say is this thread looks at trades going away from the 0 (i think...heheh), but why not trade on them snapping back to the 0, as this is surely what will happen (e.g the 0 or MA we could call it, is like an elastic band).
m
hey h
good points ....and if I had a dollar for every trader that asks me about the FXCorrelator lagging and retracing options i'd be a rich man 😆
in truth - you must live any indicator to learn how it works ......I recommend traders spend hundreds of hours on whatever indicators they use to learn it inside out .....it is doing what it is programmed to do .......we as the observers/interpreters are the issue........in not reading it properly ! :smart:
The 20ma FXCorrelator lags .......we need to live with it ........(I use non lagging indicators in my own personal trading ......trust me its overated and doesnt give you much more of an edge overall 😎)
the market is always unpredictable and will change at any time ...trading is about trying to recognise the probability of an extended move and riding it ........Trading is about taking risk and accepting losses............ sorry - if someone wants love and Guarantees they need to buy a Dog and a washing machine ! 😎
Seriously though - I would recommend traders wait till a bar has closed above / below the Zero to take decisions :smart:
Trading real time watching the lines flick up and down takes a lot of practice and experience .........one day i may get the time to teach it and the basics as well
RETRACING ?.........dont get fooled into those lovely lines falling back towards the Zero .....especially on lower MA settings below say 30ma.......its a reduction in momentum mainly.... and doesnt automatically mean that the currency is changing direction
as hybrid is doing ............why not drop an FXCorrelator onto your favourite pair ..........and then only show those 2 currencies ......and then watch it on all TF's ............you will learn quickly what the slopes and crossovers and dynamics REALLY mean.....👍
practice practice practice :smart:
N
Last edited:
NVP
Guest Author
- Messages
- 37,968
- Likes
- 2,158
I have to go
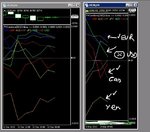
I have been watching the market re scalps and been relatively slim pickings this hour for me anyway
the main problem is a falling USD on the positive side of the Zero....remember I only scalp USD pairs so it is important to have the USD in a tradable pattern
I like to see the USD Diverging ideally.......its not !!!
watch the next new hourly bar in 15 mins time ......if USD keeps going it will breach south .....the odds then are to go to selling it and buying other currencies .......and I see the USD will then partner up with the southern Yen (remember I discussed partnerships)
and as you can see there are plenty lining up to diverge north .....so the 9am UK bar could be very very profitable !!
tell me what happens
N
Attachments
Last edited:
NVP
Guest Author
- Messages
- 37,968
- Likes
- 2,158
NVP
Guest Author
- Messages
- 37,968
- Likes
- 2,158
Last edited:
Jedster2001
Active member
- Messages
- 120
- Likes
- 3
jees such a shame I was busy earlier
A/U was 100 pips in last 2 hours ...........even if I had bagged half of them thats a good days scalping
hour -2 would have been a reaction trade though as god knows what happened re AUD.....it wasnt business hours was it ?
N
A big part of that move, around 90 pips, took place in less than 3 minutes. Man it was quick! RBA governor Stevens announced 0.85 as a more realistic level that they were targeting as an exchange rate.
Most national banks say that they are unconcerned with specific exchange rates, so for the RBA to specifically say they wanted 0.85 is quite unusual.
Anyway, you would have to have been quick to profit from that initial move, but over the next few hours AUD did weaken considerably further. AUD is definitely a medium term sell at the moment...
Expensive in financing though, if you hold the trade open for anything length of time.
Jedster2001
Active member
- Messages
- 120
- Likes
- 3
keep it coming NVP....good stuff.
just some rambling thoughts if i may....
Sometimes it looks at the indy and see a divergence, then goto the actual pair chart to look for a trade and see it looks like a "late entry" on the PA....e.g. The best time to enter has already gone.
There is nothing in indy to suggest that the current direction/s of the pair will not change at any moment - the indy tells us "what is happening and what has happened" - e.g it is as laggy as a MA.
What i'm trying to say is this thread looks at trades going away from the 0 (i think...heheh), but why not trade on them snapping back to the 0, as this is surely what will happen (e.g the 0 or MA we could call it, is like an elastic band).
m
My own personal take on that is, it can work, but you have to be planning the trade carefully. If you use both short term and long term strength meters, and they match up, they I wouldn't try and play against it. That is, if the long term is weak (for a particular currency), and the short term is also weak, then when it strengthens in the short term, I wouldn't be inclined to buy it.
However, if that situations occurs, and the short term strength does remain, then you end up with opposite strength/weakness, such as longer term weakness, and shorter term strength. Then yes, when the short term strengths turns over and heads back down, that can be a good play.
JPY and AUD are good for that at the moment. Longer term weakness, but they do have shorter periods when they strengthen periodically and could provide good entry points.
You can gauge your longer term strength by either using a longer period (50/100/200/500) on the same chart, or move to a longer timeframe, what ever you prefer.
J
NVP
Guest Author
- Messages
- 37,968
- Likes
- 2,158
A big part of that move, around 90 pips, took place in less than 3 minutes. Man it was quick! RBA governor Stevens announced 0.85 as a more realistic level that they were targeting as an exchange rate.
Most national banks say that they are unconcerned with specific exchange rates, so for the RBA to specifically say they wanted 0.85 is quite unusual.
Anyway, you would have to have been quick to profit from that initial move, but over the next few hours AUD did weaken considerably further. AUD is definitely a medium term sell at the moment...
Expensive in financing though, if you hold the trade open for anything length of time.
agreed ......
NVP
Guest Author
- Messages
- 37,968
- Likes
- 2,158
My own personal take on that is, it can work, but you have to be planning the trade carefully. If you use both short term and long term strength meters, and they match up, they I wouldn't try and play against it. That is, if the long term is weak (for a particular currency), and the short term is also weak, then when it strengthens in the short term, I wouldn't be inclined to buy it.
However, if that situations occurs, and the short term strength does remain, then you end up with opposite strength/weakness, such as longer term weakness, and shorter term strength. Then yes, when the short term strengths turns over and heads back down, that can be a good play.
JPY and AUD are good for that at the moment. Longer term weakness, but they do have shorter periods when they strengthen periodically and could provide good entry points.
You can gauge your longer term strength by either using a longer period (50/100/200/500) on the same chart, or move to a longer timeframe, what ever you prefer.
J
yes this is a nice pattern ........the classic re-entry into a longer term signal 👍
the other one that a lot of people struggle with is the Short Term TF (STTF) leading the Longer Term TF (LTTF) into a signal
in other words you have a FLAT currency that is moving fast on both TF's .....around the Zero line .....
This is a tough call as it can easily become a series of whips - because you havnt got that nice anchored LTTF sitting on one obvious direction....
up to traders if they play these.......damned if you do and damned if you dont..... :innocent:
if you can wait I would suggest as Jedster says and wait for the ole bounce plays with the STTF coming back onto the LTTF side of the action :smart:
N
Last edited:
NVP
Guest Author
- Messages
- 37,968
- Likes
- 2,158
last call as I have to go
if I was a betting man I would be buying the AUD and the NZD into USD from 9am ......certainly any scalps above that line drawn on the A/U chart if it falls back...
but watch the hourly to get the steers
good hunting
N
finally back at screens .........hmm I see the USD bounced north immediately at 9am ......so that A/U buy scalp was a 100% turnaround....
I probably would have had a go .....but clearly it was a stop before it started
such is life ........its called scalping 😎
N
Attachments
NVP
Guest Author
- Messages
- 37,968
- Likes
- 2,158
Similar threads
- Replies
- 0
- Views
- 4K