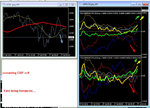
Someone asked me about volatility and market action recently
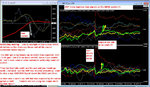
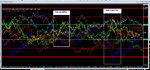
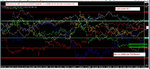
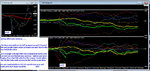
heres a 500 ma 1 hr FXcorrelator perfectly demonstrating market volatility highs and lows
the high areas are where all your BIG pips and $$'s will have been made as they represent big moves providing high volatility and offer nice trends to trade
so everytime you see a High volatility area on these charts - standby for the deluge of junk mail and trading systems telling you how much money they made.....any system can make money in trending markets 🙄
Note - what you really need to be assessing on any system is how much money it LOSES you on the Low volatility and choppy areas where the dangers are :smart:
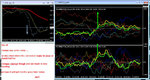
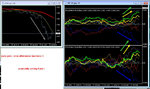
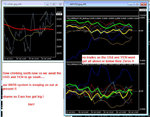
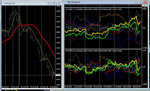
With the Dow and USD both in the Doghouse we few signals on the 80/20 system this week until thursday / friday .........
Nothing wrong with that...... I designed this particular system to be attuned to market correlation based on the DOW/YEN/USD family......and its not aligned at the moment due to the US crisis
I got a mllion others based on other market quirks and nuances observed over the last few years....and in fact this week was interesting to see how robust many of them were in real conditions
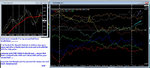
...and the FREE 80/20 on the 1 Hour will be back in action when its ready i'm
sure....nothing traded nothing lost :smart:
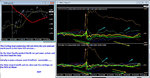
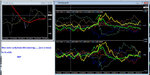
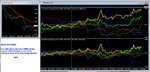
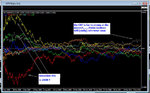
With July waving goodbye its time to look at the ole Year to date currency performances on a 1000/1 FXcorrelator setting
I'm a swissie betting man for the second half of the year ....as I mentioned earlier in this thread..........
and I'm cautiously optimistic after a decent start in July......keep that Dow flat falling through the Summer and continued USD problems and I will cruise to the Q3 title !
NZD is impressive so far but for me its to volatile and lightweight a currency to have the staying power for the title......although AUD is not ? 😏
c'mon tell me what you think....i'm here to be challenged and knocked down !! .:smart: