Corn Approaching A Major Low?

Corn chart continues to look constructive to the bull case henceforth.

A BIG clue as to the bottoming was the bullish divergence on the RSI chart, IMO.

Nice double bottom formed, then support holding,.

Fundamental factors include early frost concerns and the re-emergence of China/other demand issues. After August closes, Demand should move to the fore in terms of pricing influence.

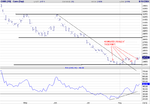
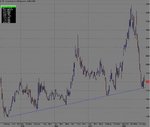
On the following chart, I've shown my buy points (where I have accumulated March 250 call options). I'm long via a Spread-bet ,the equivalent of 10 contracts (options)
 

Attachments

  • mar 05 corn.png
    mar 05 corn.png
    26.9 KB · Views: 211
Here is an interesting article on CORN (and Soybean) Fundamentals.

It includes a study on the potential effect on the market of an early frost, (in terms of how much production could be lost,etc.) and gives some price projections.

The key thing to remember, fundamentally, (frost or no frost) is that even with a record crop this year, projected world and domestic usage leaves the Supply/Demand Balance Sheet still relatively tight.

No room for the unexpected....

http://www.agriculture.com/default....articletoarticle__Aarticle_html___381___12666


Futher comments/opinions welcome. :)
 
twalker said:
U.S. Selling Wheat at Pace Not Seen for Six Years
USAgNet - 08/23/2004
More than 11 million metric tons of U.S. wheat have been exported or contracted for in the first 73 days of the 2004/05 marketing year, a pace not seen since 1997.
http://www.wisconsinagconnection.com/story-national.cfm?Id=882&yr=2004

Interesting article. How does the high exports affect wheat prices? Less domestic supply ==> higher prices? Or, producers keen to sell as they expect lower prices in (near) future?

I would agree all of the above that corn is near a major low but still expect another low below the recent double bottom. My preferred wave count is still more or less as in attached chart (eg prices are in wave 4 correction). Using an alternative count I can see wave going as high as 275, while there is of course also the bullish scenario (in a wave 3) also taking prices initially to 265-75.

However, seasonally Corn has been weak in next 4 weeks 14 of past 15 years. Yesterdays' harami / inside day may be a forewarning and IMHO doesn't strenghten the bull case.

If I were long, I would start taking profits.

As I am flat, i think a setup for short is developing:
Short entry 239, target sub 225, stop 246'ish.
 

Attachments

  • Corn25aug.gif
    Corn25aug.gif
    15.3 KB · Views: 207
High export is definitely bullish as it relates directly to demand side of equation with assumed fixed supply.
 
not sure the article actually makes any significant indication to changes in the Demand and Supply Eq. for Corn.

The supply is there its just being exported - true the export is driven by greater demand from abroad - but its easily being absorbed from what I can see..
 
I think a key factor in the Supply/Demand equation for both Corn and Wheat is the relative tightness of the balance sheet going forward.

World Carryout/Ending stocks could still wind up tight again in the 2004-2005 crop year. I don't have the precise figures to hand (see USDA site for that), but you have to go back to the 1970's to see a similar scenario, I believe.

Wheat, for example, could hold down at 3 months supply in 2005.

US Corn, via exponential growth in ethanol demand, and feed-use, has a demand figure of around 10.7+ bn bushels pencilled in. YES, there's a record crop coming, but if it can't match this figure, production wise, (or ends up very close), ending stocks could fall to levels not seen in 30 years.

Add in ANY FORM of supply scare to the mix, and you have the POTENTIAL for explosive price moves.

All in my opinion, ofcourse. :|
 
Chicago price is driven by US SnD therefore additional exports are bullish.
This is of course Wheat exports not Corn but the inherent spread relationship does lead to overall effect on the wheat/corn/soy complex.
 
There was a very good assessement of the Corn situation on DTN Audio (DTN ON-AIR) last night , I believe.

Haven't had chance to listen yet, but below I've copied isome of the graphs and charts that were used in the program.

Top hear the program, (and other archived broadcasts), visit the website and click on ' DTN ON AIR' , the select INSTANT REPLAY from the drop-down menu.

I regularly listen to these broadcasts, which I find useful and informative. Some are for Hedgers (farmers) , others aimed at speculators.

www.dtnradio.com
 

Attachments

  • CORN BALANCE SHEET.gif
    CORN BALANCE SHEET.gif
    12.1 KB · Views: 216
  • CORN EXPORTS.gif
    CORN EXPORTS.gif
    18.8 KB · Views: 194
  • ETHANOL USAGE.gif
    ETHANOL USAGE.gif
    15.9 KB · Views: 203
Here are the last two :
 

Attachments

  • CORN CROP CONDITION GRAPHS.gif
    CORN CROP CONDITION GRAPHS.gif
    13 KB · Views: 208
  • CORN PRODUCTION.gif
    CORN PRODUCTION.gif
    21.9 KB · Views: 210
I finally tuned into the above at lunchtime today.

A very good discussion with an analyst at Brock Associates on the Corn market.

Again, take a look at the WORLD ENDING STOCKS figures in the first table above. This shows a year-on-year decline since 2000. Also note stocks-to-use ratio (%)

Corn sold off yesterday.
 
As has been shown before , the unadjusted weekly chart. Would be interesting to see an adjusted chart if anybody has done the work or has TS supplied continuous back adjusted data.
I have not spent time looking at fundamentals this year but my rationale is simple. If I am not prepared to buy off the weekly support on this chart then when would I be prepared to buy? probably never. You just have to pull the trigger on these sorts of things as some of them will work out very well and downside risk is not huge. Same goes for Wheat and Soymeal IMHO.
Just stick it away and don't forget the rollovers.
And this is not investment advice, I may very well be wrong.
 

Attachments

  • Corn.JPG
    Corn.JPG
    121.2 KB · Views: 167
I agree entirely Twalker.

I accumulated Mar 250 calls based on the weekly support you show on your chart, but backed up my decision on the above fundamentals.

Let's see how she fairs from now thru December. Could be interesting.
 
twalker said:
As has been shown before , the unadjusted weekly chart. Would be interesting to see an adjusted chart if anybody has done the work or has TS supplied continuous back adjusted data.
I have not spent time looking at fundamentals this year but my rationale is simple. If I am not prepared to buy off the weekly support on this chart then when would I be prepared to buy? probably never. You just have to pull the trigger on these sorts of things as some of them will work out very well and downside risk is not huge. Same goes for Wheat and Soymeal IMHO.
Just stick it away and don't forget the rollovers.
And this is not investment advice, I may very well be wrong.

Set-up on weekly chart is clear. Key question IMHO is what to use as the trigger to go long?

I tend to set my triggers based on daily patterns. I still see a wave 5 down developing before the a substantial bottom is in place. For now, i am short C Z4 at 238 3/4 with tight stop.
Pattern seems to be very similar in most grains and some softs (KC & CT)
 
TWALKER -

Corn Weekly Continuous Cash - chart attached.

Is this what you were referring to?
 

Attachments

  • CORN WEEKLY CONTINUOUS CASH.gif
    CORN WEEKLY CONTINUOUS CASH.gif
    24.9 KB · Views: 295
Or Weekly Continuous Dec Chart -
 

Attachments

  • wekkly cont DEC.gif
    wekkly cont DEC.gif
    25.8 KB · Views: 153
I went long december corn, monday MOC.

My seasonal study is compatible with some move upwards (see it in my site); also technicals seem to show some strenght after recent lows (at 255); this might also be a 123 bottom.

Target 251.

If things turn wrong, I might transform into a spread selling Jul. 05.

Also, a followup might consist in selling calls against my position. Shall see later.
 
I placed my stop @ 235 1/2 to cover my entry point, and guess what, I sold at the low for the day...

I am still short Dec 250 Call, so I have basically reversed my initial position.

Technically speaking, volume on Sep. 1st. was very high, but price action showed uncertainess; close was only slightly above the midrange. This might have suggested to close long postion MOC. Sorry that volume figures come one day later...
 
Moneycat - what is your time frame and target for this trade?

The Corn market is trading weather at the moment, and as the forecasts for a possible frost 'flip-flop' from day to day , so the market adjusts, and volatility increases.

I have been long Corn (via MAR 05 options) since July 27th, when the weekly support line was first approached.

So far this support has held and I continue to anticipate a gradual retracement of the June-July downswing. I am in for the long-term (ie Mar 05), so short-term reactions mean little to me.

It is a seasonal long-term position trade.
 
Dave, thanks for your question: you allow me making my trade clearer...

I bought Dec. as this is the most liquid contract; my target was firstly 245, then set higher at 250. I have no tiem frame, but I intended it as a short term trade: technically we are still in downtrend...

I sold Dec. Call as this was the same expiration as the contract.

Now I am left with Short Dec. Call, which is clearly too long a time frame for writing options.

What next? Either set a repurchasing target, or buy Dec. and sell (say) Nov.

Tiem will tell.
 
Top