You are using an out of date browser. It may not display this or other websites correctly.
You should upgrade or use an alternative browser.
You should upgrade or use an alternative browser.
TWI
Senior member
- Messages
- 2,562
- Likes
- 269
As China is a major factor in grains it is interesting that markets are ignoring this story. Small change in their SnD could make quite a difference to US/SAM export demand.
Locust plague strips Inner Mongolian grasslands
China View
2004-08-03
BEIJING, Aug. 3 (Xinhuanet) -- Inner Mongolia is being hit hard by a locust plague that is stripping the area's grasslands, reported Tuesday's China Daily.
http://news.xinhuanet.com/english/2004-08/03/content_1700428.htm
Locust plague strips Inner Mongolian grasslands
China View
2004-08-03
BEIJING, Aug. 3 (Xinhuanet) -- Inner Mongolia is being hit hard by a locust plague that is stripping the area's grasslands, reported Tuesday's China Daily.
http://news.xinhuanet.com/english/2004-08/03/content_1700428.htm
DaveT said:Corn is now stabilising after touching long-term trendline support this week.
My March 250 calls are steady at 9-10 cents.
I'm expecting a choppy recovery from August to December on seasonal and other factors.
BOT CZ4 near the close @ 227; My initial Target & Stop are resp T>236 & S=224 1/2
Based on Wave analyis, I still think Corn hasn't completed the bear market. This rally might even be a wave 4 taking prices to as high as 250-270 range. Not convinced. We'll see.
Attachments
Bgold -
consider the points raised in the following article :
_ James Mound Trading Group _
Grain Outlook
By JMTG’s Head Analyst James Mound
August 3rd, 2004
Readers of my Weekend Commodities Review and the Mound Trade Signals are well aware of my bearish outlook in grains for most of the year. And after riding one of the biggest downtrends in history, I am excited to announce a new trend prediction in the market. After a year of some of the most violent and volatile grain moves in history we are approaching yet another critical juncture in grain pricing that deserves attention. A deep look at the market utilizing common sense, seasonality analysis and both a micro and macro perspective suggests this is an ideal time to buy grains for the intermediate term. This article explains the logic and recommends ways to profit from the bull trend ahead.
History repeats itself. Time after time the grain markets repeat its cyclical tendencies based on supply and demand fluctuations and their affect on plantings. Weather is obviously the unknown (although some could make a solid case for predictability in this arena as well) by comparison, but nevertheless the grain markets have a clear pattern. Let’s take a quick technical review of the past half decade plus.
*Chart courtesy of Gecko Software’s TracknTrade.
*Chart courtesy of Gecko Software’s TracknTrade
*Chart courtesy of Gecko Software’s TracknTrade.
As the chart analysis above would indicate, a four year plus doldrums from ideal crops put a large carryover crop and a healthy supply market on the shoulders of a price depressed market. Typical of cyclical farming markets, the supply base shriveled up over the years as declining profits and buyouts brought about a period of reduced plantings and declining new crop growth. Good weather always hurts, however, and great crop after great crop brought a base of price support rarely seen throughout the recent history of the grain markets. At the time, one could find very little technical or fundamental justification for buying grains, but a good cyclical trader would have agreed with my analysis at the time. In the exchange traded history of soybeans, I challenge you to find any period of more than five years that the market did not experience at least a 40% price rally. So of course you combine a declining level of growth in plantings with a 6 week hot and dry weather run in the middle of the growing season and Eureka! A strong grain rally in ’02 depleted the carry-over inventory from the prior years’ ideal harvests and setup what could have been an explosive year in ’03. But good weather put the kibosh on the follow through rally. Then the unknown China demand factor spiked the markets as the demand far exceeded any demand crisis I can ever remember, especially with supply in reasonable form. Beans rocketed to plus $10 prices and put the market in a state of hysteria with no supply, high demand, and the guts of the growing season still ahead. This was a key sell signal as the history of soybeans suggests buying puts with 4-6 months of time when the market exceeds $9 bushel has a proven history of high success. Now we head into harvest with a massive epic retracement under our belts and no one having a clue what’s next.
History repeats, right? Well common sense tells you that there are certain identifiable points of reasonable price support. The market has no reason to retrace to 2001 prices because the market must factor in a premium that exists now but didn’t exist back then – China demand. Growing demand set against a backdrop of no carry-over inventory isn’t such a bearish place to be prior to harvest. This is an ideal time to play on an oversold condition just prior to critical technical support being hit and ahead of any illogical retest of 2001 prices. Also, periods just following extreme price moves during the growing season (just prior to and during harvest) are often times when the market trades counter seasonal, suggesting this harvest year is a time to buy. Look at the price charts, toss the fundamentals around and you will come to the same conclusion I have – Buy now.
So you are a semi-intelligent person who identifies the inherent risk in buying futures in a free falling market – what do you do now? Here’s a few ideas to get the mind working in the right direction:
Corn: Buy a Dec. futures around 227 and buy a 220 put for protection. This will run you about $350 and has a max risk and margin of $700 while offering unlimited profit potential and trade protection for almost 4 months. I would suggest selling a 250 call on a rally to 240 if it occurs in the next 5 weeks. This would help to lock in profits, reduce or eliminate the risk and margin on the trade and still allow you to benefit from additional gains in the market.
Soybeans: Call premiums are still over priced, while puts remain at a discount. Nevertheless, I recommend a simple bull call spread with a Nov. expiration. Look at buying a 620 call and selling a 660 against it for about $300. If you want a wider risk to reward ratio and have a higher expectation for beans, spread it with a long 620 call and sell a 700 call against it for about $450.
Wheat: Sell one Oct. 340 call and buy three Oct. 350 calls for a cost of about $300. This trade carries a margin requirement of about $600 and a max risk and max margin of $800. Loss at expiration if the market is below 3.40 is the cost of the trade ($300). This essentially gets you long the equivalent of two futures at a price of 3.58 for an upfront cost of $300. This is a good ratio breakout spread to play on a bull run in the next 7 weeks.
Pick your favorite grain and start the bandwagon by seeing the market before it happens.
Disclaimer: There is risk of loss in all commodities trading. Commissions and fees vary per individual and therefore are not included in profit, cost and risk scenarios. Please consult a James Mound Trading Group Broker before you trade for the first time. Losses can exceed your account size and/or margin requirements. Commodities trading can be extremely risky and is not for everyone. Some option strategies have unlimited risk. Educate yourself on the risks and rewards of such investing prior to trading. James Mound Trading Group, or anyone associated with JMTG or moundreport.com, do not guarantee profits or pre-determined loss points, and are not held monetarily responsible for the trading losses of others (clients or otherwise). Past results are by no means indicative of potential future returns.
Also found this interesting assessment of corn and soybeans fundamentals , which suggests that the market has priced in too-high a production assumption. (esp corn)
http://www.farmdoc.uiuc.edu/marketing/weekly/html/080204.html
http://www.farmdoc.uiuc.edu/marketing/weekly/html/080204.html
DaveT said:Also found this interesting assessment of corn and soybeans fundamentals , which suggests that the market has priced in too-high a production assumption. (esp corn)
http://www.farmdoc.uiuc.edu/marketing/weekly/html/080204.html
Both very interesting. many thanks. Really appreciated.
Lacking fundamental knowledge (and understanding), I do stick to the technical analysis and will try to let my trading being dictated by what I see in charts and volume analyses. That said, the analysis supports the view that the growing season has to contnue to go exceptionally well to support lower prices ahead.
Considering this downtrend has been so hard, I would still be surprised if Corn were to reverse up in one straight line. We will, no doubt, have ample trading opportunities in the next bull run, when many observers expect to see Corn to go beyond $4
As for the Mound trading reco's. I do like the Corn idea but past experience with assymetric pay-off derivatives stops me from trading options. Reason: Options valuations are essentially determined by volatility and time (rates are very low). Unless one manages option risk in terms of Delta and Gamma (change of delta as result of price change), I think buying optrions is an expensive hobby as identical strategies can be devised by trading the futures (eg increasing and reducing futures exposure subject to price) without time decay. This is because (in a perfect world), te option premium reporesents nothing but the discounted value of future hedging costs. Therefore, I would only consider to buy if Vols are expected to go up and vice versa.
I didn't really understand Mound's wheat strategy as the oct strikes are very illiquid.
As for seasonality, the attached should be interesting. Corn tends to be seasonally weak between mid-aug and mid-sep (various reasons). The effect is especially strong in bear years!
So don't bet the barn on start of mother of all bulls :cheesy:
Attachments
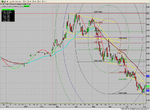
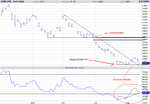
MARCH CORN -
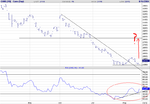
For those waiting for solid technical signals to buy, Corn is screaming UP now, IMO.
See chart for :
1) Saucer Bottom
2) Downtrend line broken
3) MACD Crossover UP + Slow Stochastic rises above oversold (20)
All bearish factors have been priced in IMO.
I Added to my Mar 250 Calls on the open yesterday, getting 9.5 mid. Closed at 11.8 mid.
My target for the March futues is the gap at 278-283.
Attachments
DaveT said:MARCH CORN -
For those waiting for solid technical signals to buy, Corn is screaming UP now, IMO.
See chart for :
1) Saucer Bottom
2) Downtrend line broken
3) MACD Crossover UP + Slow Stochastic rises above oversold (20)
All bearish factors have been priced in IMO.
I Added to my Mar 250 Calls on the open yesterday, getting 9.5 mid. Closed at 11.8 mid.
My target for the March futues is the gap at 278-283.
Gap at 275 (Dec contract) seems a possible target for this bear market rally but I wouldn't be surprised rally stalling in 250-55 range of the previous wave 4 around 12 July. many observers look for it to stall at curent levels of 235. Current patterns seem to have all hallmarks of short covering by bears. Let's see if the OI confirms. If OI falls considerably in rally, I would watch out. For now, I remain long but have raised stops to just below yesterdays' lows.
DaveT, what is reason to analyse and trade the relatively less liquid March05 contract? CH5 OI is 65k vs CZ4 is 319k. Thanks
Bgold -
As I am trading the Corn with long call options, potentially long-term, (to maximise leverage on a retracement), I was looking for a time frame which would give me a greater probability of success.
I trade with an SB, where Dec call options expire mid-November. (March calls expire mid-february 05.)
In the March contract, 250 calls have greatest OI and volume recently.
So for this long-term position trade, I need to see my calls in-the-money at any time from now to February 05, to be profitable.
It does not matter to me whether it happens this summer (on weather), this fall (on demand/yields) or next winter (on demand). I personally think the long-term fundamentals do not justify prices much lower than these levels this year, (but I could be wrong!)
Also, take a look at the Corn monthly 30-year chart, and seasonal charts. Both have many historical examples of a long-term recovery from august lows to spring highs.
Just my opinion and my way of trading it.
CORN AND GRAINS - fundamentals -
there are 2 factors that jolt this market in the short-term, IMO
1) Aug 12th monthly Supply/Demand report - first indication of crop size and yield potential. Anything less that 10.8 Bn bushels for corn could be construed as bullish, as the market has been pricing in 11 bn + crop size.
2) There is a persistant cool airstream setting up across the US Corn Belt. Crops lack heat units (disappointing yield?) and could be susceptible to frost scares/actual damage in a few weeks time. There are already fears for the Canola crop up north in Canada.
Don't regard this crop as 'made and in the bin' just yet....
Moneycat
Member
- Messages
- 75
- Likes
- 0
I have made some seasonal studies based on December expiration.
It seems that there is a tendency to make a minor bottom, by mid-august; a bounce follows, before new lows are reached around expiration.
A chart and free raw data available for download from my site.
It seems that there is a tendency to make a minor bottom, by mid-august; a bounce follows, before new lows are reached around expiration.
A chart and free raw data available for download from my site.
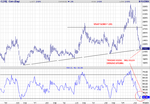
Thanks Moneycat for that observation.
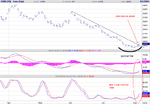
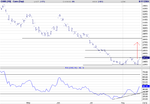
The big CROP REPORT came out today - CORN est. 10.9 bn bushels, a record. This was above trade expectations, and has sent the futures down to retest their recent lows.
However, this support level represents a four year uptrend on the monthly charts, and could hold. Obviously if it doesn't , look out below!
I'm following the March 05 chart (as I have march 250 call options). Note the BULLISH MOMENTUM DIVERGENCE (RSI) , which hints that the market may not be as weak as it looks.
We could be in the process of forming a long-term double bottom on the daily charts.
See chart attatched :
Attachments
minx
Well-known member
- Messages
- 328
- Likes
- 10
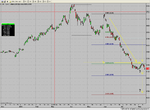
I got a bit concerned that we couldn't close above the 1.61 Fib level and then we fell quite quickly. As the first 3 days of these falls seem to be quite rapid (see wheat, cotton, etc.. on their falls, retrace and further falls) followed by a period of indecision I'll be very interested to see what happens today. I was a bit unimpressed by the retrace in corn yesterday especially as wheat and oats managed to hold more of their decline......
Like I said, todays first couple of hours should be interesting....
Like I said, todays first couple of hours should be interesting....
Attachments
Similar threads
- Replies
- 2
- Views
- 58K
0
- Replies
- 2
- Views
- 3K
- Replies
- 11
- Views
- 7K
- Replies
- 3
- Views
- 6K
- Replies
- 3
- Views
- 6K