Hi all,
I have been given the following assignment in work placement and with only basic prior excel experience I am not sure how to go about setting this following question up.
"Using excel, map out the pay-offs on a "collar" and "butterfly" trading strategies. Use VBA to calculate premia."
I would really appreciate any help as the deadline is Wednesday
kind regards
P
Not a lot to go on, and without knowing any values or the expected background, below is what I would do:
For the butterfly, I would start with a column labelled Asset_Price_at_Maturity (or Spot if you're lazy like me
🙂 ), next to a column labelled Payoff. A few columns to the right of these, inputs of 'Spot_increment', 'Mid_Strike', 'Strike_diff' or some better names that you prefer. Just single cells for these. So for a butterfly with strikes 80,100,120, you would have 100 in the cell to the right of the words Mid_Strike, and 20 in the cell to the right of Strike_diff.
Then put a 0 in the first cell in the spot column, perhaps an increment of 5 in the increment cell (or 1 if you like), and then drag down the spot column, so that it goes 0,5,10,15,...
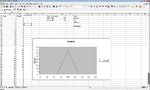
Then you can calculate the payoff for each spot, referring to the strike cells. Drag this payoff column down, and plot it with Spot along the x-axis, payoff along the y-axis. You will know you have done it correctly (or incorrectly) because you can search online for the payoff diagram of a butterfly and compare to what it should look like. This chart is lacking the initial premium paid, so it is all above 0.
Let me know if any of the above isn't straightforward. It might look something like the pic attached, but I'm confident you can make it look much better and name things in a better way. My Excel version is ancient.
Next you need to do the premia in VBA. Since a butterfly is just a combination of long and short of call options, you will need extra cells with inputs for the call option (or a button - see below), like 'interest', 'volatility', 'expiry'. I don't know what your experience with VBA is like, so you'll have to give feedback before I say any more on that, i.e. "I've never used it before", "I've programmed some simple stuff in it". If you're an expert in VBA you already have enough info to complete the task I'd guess.
Once you can get the premium for one individual choice of parameters, spot, interest, vol, maturity and strike, then you can create another column and plot the premia for all the spots in column A and maybe plot that. Again, I don't really know what is expected from that one line.
Since we're using VBA, you can put a button which when clicked gives a pop-up box that asks for the various parameters required to price the option. They may want this.