Can someone explain this

Nowler

Experienced member
Messages
1,548
Likes
221
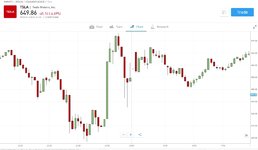
I drew a trend line (Yellow horizontal line) on the weekly chart which shows price peaking just above the line.
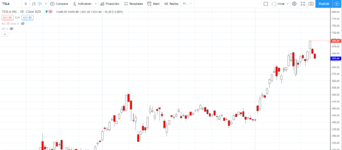
But when I moved down to the daily, price is no where in the same area, in relation to the line.

I have been going back and forth with my broker for the last hour now, and have spoken to 2 people.

Am I going crazy, or is this way off!? :)

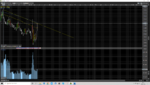
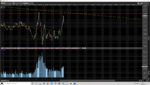
In terms of technical analysis, this would be useless unless I stay on the weekly chart.
But it's quite a basic practice to look at higher timeframes, draw some lines, and then move in for a close look at price structure.

I wouldn't mind a little off... but this is far more than a little :)
 

Attachments

  • Weekly 2.PNG
    Weekly 2.PNG
    189.2 KB · Views: 275
  • Daily 2.PNG
    Daily 2.PNG
    183.3 KB · Views: 289
Last edited:
But its not the same line, surely? I mean, the two lines are between different extremes so clearly they cannot both touch the same intermediate point.
 
But its not the same line, surely? I mean, the two lines are between different extremes so clearly they cannot both touch the same intermediate point.

I don't quite follow.
I only drew 1 line (on the weekly), and then I dropped down to the daily to have a closer look.
I expected to see price penetrate the trendline I drew on the weekly, but it wasn't even near the line.
In fact, looking at the daily, the last time price went near the line was around March.

I'm baffled
 
Thanks, I see what you mean now. The price level horizontal line is the same but the trendline has shifted. I guess its an eccentric way the software re-draws it. Surprising though.
 
Thanks, I see what you mean now. The price level horizontal line is the same but the trendline has shifted. I guess its an eccentric way the software re-draws it. Surprising though.

Yeah, the second person I spoke to mentioned that it may not be a bug, and that it was due to some reason.
She was unable to provide a reason... and I cannot think of a practical purpose for it to be so.

It essentially means anything I use on 1 TF, cannot be relied on for another TF... which is a bit stupid really when you think about it :ROFLMAO:
 
The high, low, open and close of a weekly bar all occur at a single point on the x axis of the weekly chart, but when you drop down to a daily chart these prices are spread out at different points throughout the week. So you could get the week's high on a Monday, Wednesday or Friday for example, but this price would only appear at one point on the weekly hence the discrepancy. On the daily chart, if you plotted the week's high not on the actual day it occurred but at the end of the week there should be agreement between the two charts.
 
The high, low, open and close of a weekly bar all occur at a single point on the x axis of the weekly chart, but when you drop down to a daily chart these prices are spread out at different points throughout the week. So you could get the week's high on a Monday, Wednesday or Friday for example, but this price would only appear at one point on the weekly hence the discrepancy. On the daily chart, if you plotted the week's high not on the actual day it occurred but at the end of the week there should be agreement between the two charts.

I think I understand what you are saying, but it doesn't explain how the last time price touched or went anywhere near the line on the daily, was back in March...

From my understanding of your explanation, we would assume one of the last 5 daily candles would touch the trendline, right?
 
Hi Nowler,

I'm a complete newbie, and I can't answer your question. I had the exact same problem on tradingview yesterday. It makes no sense at all. I really could use someone explaining it to me.

I could also use an explanation for this, similar kind of issue...

December the 18th, Friday, Tesla closed at 695. Here's the 5 day chart from Google. There's no 695 anywhere, except you can see below, it says previous day close 695. The highest point is just above 680 just before Dec the 21st starts.

Attached also the 1m chart from my broker (etoro), which has the last candle on Friday, and the first candle on Monday. There's no 695 anywhere.

WHAT IS GOING ON?
 

Attachments

  • TSLA etoro.jpg
    TSLA etoro.jpg
    140.5 KB · Views: 170
  • TSLA chart.jpg
    TSLA chart.jpg
    242.9 KB · Views: 179
Hi Nowler,

I'm a complete newbie, and I can't answer your question. I had the exact same problem on tradingview yesterday. It makes no sense at all. I really could use someone explaining it to me.

I could also use an explanation for this, similar kind of issue...

December the 18th, Friday, Tesla closed at 695. Here's the 5 day chart from Google. There's no 695 anywhere, except you can see below, it says previous day close 695. The highest point is just above 680 just before Dec the 21st starts.

Attached also the 1m chart from my broker (etoro), which has the last candle on Friday, and the first candle on Monday. There's no 695 anywhere.

WHAT IS GOING ON?
1608639924940.png


definitely reached 695. you may want to look at more reliable sources for data
 
View attachment 293223

definitely reached 695. you may want to look at more reliable sources for data
695 for sure, I saw it with my own eyes... and google, etoro both mention it, but it's not on any of the charts. It's not on tradingview's chart either. What is going on with these BS charts?!

Which chart is reliable?!
 
695 for sure, I saw it with my own eyes... and google, etoro both mention it, but it's not on any of the charts. It's not on tradingview's chart either. What is going on with these BS charts?!

Which chart is reliable?!
Its on tradingview also..
1608652133126.png
 

Attachments

  • 1608652043037.png
    1608652043037.png
    89 KB · Views: 171
Here's my 5m TSLA tradingview chart... there's no 695. It's about 686 or something..

Admittedly though, after seeing your chart 1stinvest, I looked and I could see it on the daily chart. I've got to be very careful with what I'm drawing on these charts... I don't know how I'm going to know which one is correct.

Thanks for taking the time to reply buddy.

1608706575889.png
 
Here's my 5m TSLA tradingview chart... there's no 695. It's about 686 or something..

Admittedly though, after seeing your chart 1stinvest, I looked and I could see it on the daily chart. I've got to be very careful with what I'm drawing on these charts... I don't know how I'm going to know which one is correct.

Thanks for taking the time to reply buddy.

View attachment 293252
You're right Tramadoon, during the day the price did not hit 695. I checked also on my prices
It shows up on the end of day only, so it can only be related to pre or post market activity.
 
You're right Tramadoon, during the day the price did not hit 695. I checked also on my prices
It shows up on the end of day only, so it can only be related to pre or post market activity.

The lower price would have been the price at the closing bell. The higher closing price would have been as a result of the closing cross process used to establish a closing price after the close. Your intraday charts would show the price at the closing bell since they would not record after hours adjustments - their daily charts would likely show the higher price when it had been set.

“Of course, the closing price of a stock is just as important. After all, when mutual funds report their values each day, they do it using the closing price of stocks. Moreover, news organizations broadcast closing prices to the world, and many people make their overnight buying and selling decisions based on closing prices. So, just as with its opening cross, NASDAQ uses a similarly rigorous closing cross process to determine the correct closing price of any given stock.”
 
Last edited:
Top