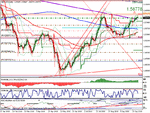
GBP/USD 4hr Setup in The Daily Time Frame

rolston

Well-known member
Messages
390
Likes
1
[/ATTACH]


Hi My name is rolston i trade GBP/USD USD/YPL EUR/USD

When I Trade I use all time frames monthly to 1 min chart

I trade off all Timeframes using support or resistance as will fibs entering on the 1min chart.

THE MOST important thing you most now when trading is what TIME FRAME you are trading in
i.e. GBP/USD is in the MonthlyTime Frame but it has to find support above the Monthly moving avg with big resistance at 1.600

What is happening as off close Friday?

1. Price 1.59678 resistance here if broken TO UP SIDE target 1.600 if broken 1.60839

2. Price 1.59678 resistance Here if NOT BROCKEN DOWN SIDE Target Fist.

3. We are in a UPTREND

Trading Off 1Hr Support Line in (Daily/Weekly Time Frame)
a. support line at 1.5838
B. 1Hr Support at 1.58451
c. ENTRY BUY 1.58279 (STOP 1.57779)


Trading Off 4 Hr Support Line in ( Daily/Weekly Time Frame)
a. Support Line at 1.57846
b.ENTRY BUY 1.57846 (STOP 1.57443)
 

Attachments

  • 1 hour  chart.gif
    1 hour chart.gif
    30.2 KB · Views: 495
Entered trade at
1lot at BUY 1.5869 STOP infront off price T/P 1.5985
1lot at Buy 1.5870 Stop Infront Of price T/P 1.5941
1lot at BUY 1.5871 Stop infront of price T/P 1.5901


Hope you like the trade
 
1
[/ATTACH]
Hi

My Charts

The 5m 15m 1hr 4hr
I do us th weekly and monthly charts,

trades looking good.

will be back

Hi My name is rolston i trade GBP/USD USD/YPL EUR/USD

When I Trade I use all time frames monthly to 1 min chart

I trade off all Timeframes using support or resistance as will fibs entering on the 1min chart.

THE MOST important thing you most now when trading is what TIME FRAME you are trading in
i.e. GBP/USD is in the MonthlyTime Frame but it has to find support above the Monthly moving avg with big resistance at 1.600

What is happening as off close Friday?

1. Price 1.59678 resistance here if broken TO UP SIDE target 1.600 if broken 1.60839

2. Price 1.59678 resistance Here if NOT BROCKEN DOWN SIDE Target Fist.

3. We are in a UPTREND

Trading Off 1Hr Support Line in (Daily/Weekly Time Frame)
a. support line at 1.5838
B. 1Hr Support at 1.58451
c. ENTRY BUY 1.58279 (STOP 1.57779)


Trading Off 4 Hr Support Line in ( Daily/Weekly Time Frame)
a. Support Line at 1.57846
b.ENTRY BUY 1.57846 (STOP 1.57443)
 

Attachments

  • 15 m chart.gif
    15 m chart.gif
    31.2 KB · Views: 725
  • 5 m chart.gif
    5 m chart.gif
    24.8 KB · Views: 577
  • daily  chart.gif
    daily chart.gif
    31.8 KB · Views: 536
[/ATTACH]


Hi My name is rolston i trade GBP/USD USD/YPL EUR/USD

When I Trade I use all time frames monthly to 1 min chart

I trade off all Timeframes using support or resistance as will fibs entering on the 1min chart.

THE MOST important thing you most now when trading is what TIME FRAME you are trading in
i.e. GBP/USD is in the MonthlyTime Frame but it has to find support above the Monthly moving avg with big resistance at 1.600

What is happening as off close Friday?

1. Price 1.59678 resistance here if broken TO UP SIDE target 1.600 if broken 1.60839

2. Price 1.59678 resistance Here if NOT BROCKEN DOWN SIDE Target Fist.

3. We are in a UPTREND

Trading Off 1Hr Support Line in (Daily/Weekly Time Frame)
a. support line at 1.5838
B. 1Hr Support at 1.58451
c. ENTRY BUY 1.58279 (STOP 1.57779)


Trading Off 4 Hr Support Line in ( Daily/Weekly Time Frame)
a. Support Line at 1.57846
b.ENTRY BUY 1.57846 (STOP 1.57443)

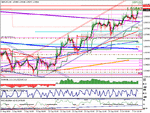
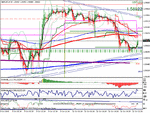
buy
 
we are looking to stay above 1.5785 for moves to the upside

below 1.5785 an
 
[/ATTACH]


Hi My name is rolston i trade GBP/USD USD/YPL EUR/USD

When I Trade I use all time frames monthly to 1 min chart

I trade off all Timeframes using support or resistance as will fibs entering on the 1min chart.

THE MOST important thing you most now when trading is what TIME FRAME you are trading in
i.e. GBP/USD is in the MonthlyTime Frame but it has to find support above the Monthly moving avg with big resistance at 1.600

What is happening as off close Friday?

1. Price 1.59678 resistance here if broken TO UP SIDE target 1.600 if broken 1.60839

2. Price 1.59678 resistance Here if NOT BROCKEN DOWN SIDE Target Fist.

3. We are in a UPTREND

Trading Off 1Hr Support Line in (Daily/Weekly Time Frame)
a. support line at 1.5838
B. 1Hr Support at 1.58451
c. ENTRY BUY 1.58279 (STOP 1.57779)


Trading Off 4 Hr Support Line in ( Daily/Weekly Time Frame)
a. Support Line at 1.57846
b.ENTRY BUY 1.57846 (STOP 1.57443)
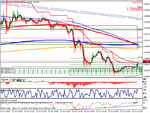
any chance you could simplify your charts, it's just one big block of crayon mess at the moment.
 
Price Pulling down to daily moving avg price suported above coming down to RSI suport line on daily chart looking to go long
 
from this area we are looking at the RSI Support line to hold On the daily chart it may pull down a little more hear we may see the staring of a swing trade up
 
most put stops inplace infront or below

1.5824 target 1
1.5847 target 2
1.5889 target 3
1.5920 taget 4
 
must build suport now on the 1min chart 5min 15min 30m 1hr 4hr up to daily then we look at are higher timeframes for braks to the upside on the RSI

the 1min timeframe is showing use its still suported above the daily and 4hourly moving avg

still holding with stops in place
 
still building suport on 1min & 5Min Chart to 15 min rist can have small pullback to 1.5790 if she do not go higher from DS2
 
Goog Morrning all

i will be looking at the market up till 8.00 uk time will not be trading today

1. take part profit here.

2. fist support at 1.5791 15min chart

3. london will be the make or brake to the upside

4. Most have stops inplace.

5. it will ok to wessage me with Qest
 
Top