Calculating High Probability Trades

For new traders I feel it is best to keep it simple and see how far the basic tools can take you. I like the INDE system because it is simple, and the analysis shown above is really the tip of the iceberg. Tested to the extreme the INDE system can reveal some interesting results.

The accumulation factor can be made smaller than 3, and is not limited to integers, and decimal numbers can be used. Or to develop it further you could even try to construct a system which 'trades' the equity curve so that you are only in the market when the profitable windows are opening.

The difficulty I have with predictive models is that they are just that, models. They are all based on human mathematics, which is limited. The financial markets exhibit a natural mathematics which is a infinite gestalt of exquisite imbalances. It is always throwing curve balls. Don't ask me how it does it, but it's light years ahead of the rational human mind.

Remember that too many flawed premises is a house of cards.

Total Bollox and pure lultz:whistling
 
Show me your way with the same amount of precision. I like detail, bring it on.
I have nothing to prove or desire to puff my ego as you appear to do. But look up price action plus support and resistance which is all many people need.:whistling

Ps.
Is your first name Albert and have you a penchant for purple prose
 
I have nothing to prove or desire to puff my ego as you appear to do. But look up price action plus support and resistance which is all many people need.:whistling

Ps.
Is your first name Albert and have you a penchant for purple prose

Show me how price action plus support and resistance equals profit. You are talking as an artist having now learnt all of this. New traders are on the road to developing this artform, and a mathematical approach can help.

Come back to me when you can show me that you can show others how to trade. This is a 'First Steps' forum.
 
APPENDIX

Attached is a barebones INDE platform in Excel format. It's open source so you can modify it as much as you wish. Some customising examples are given on the YouTube indetrader channel (switch to HD quality for clearest screenshots).

If you don't have Excel you can download OpenOffice and open/save it in OpenCalc. If you have Excel then the only main difference when modifying is to use commas instead of semicolons.

It's all contained on one worksheet: inputs, outputs, engine and charts. Columns BCDE are the inputs for your own price data; the specimen data can be deleted. For small accumulation factors you don't really need to start with 40 rows of inputs, so you can modify to suit. As each new price bar opens in normal time you simply insert a new line below the last price line (ie the one above the grey zone), then copy and paste the last price line to this new line and adjust the time/price inputs accordingly.

You may also want to keep track of your equity in columns JK.

If you want to trade more than one market (not always necessary if you learn how to trade one market well), then simply copy/create a new worksheet and change the inputs accordingly.

It can also be converted into a testing platform by inserting/copying/pasting a greater number of lines. This is best done in Excel as it has a much quicker processing speed.

When the number of price lines becomes too cluttered on your screen/charts then just highlight the topmost price rows, right click, then click 'Hide' (click Unhide/Show to reverse this process).

A good way to start is to have it running in the background to your other trading activities, possibly trading daily prices on an index at a small to medium accumulation factor, small stake to begin with.

You can also practice the process on intraday data, paper trading or using very small stakes, so that you can become used to the system of making inputs and adjusting stops.

Watch out for 'outside days', they are the biggest curve balls, but in time you will find your way around them.

If you have any queries as to operation then please post.


View attachment INDE.xls
 
APPENDIX

Attached is a barebones INDE platform in Excel format. It's open source so you can modify it as much as you wish. Some customising examples are given on the YouTube indetrader channel (switch to HD quality for clearest screenshots).

If you don't have Excel you can download OpenOffice and open/save it in OpenCalc. If you have Excel then the only main difference when modifying is to use commas instead of semicolons.

It's all contained on one worksheet: inputs, outputs, engine and charts. Columns BCDE are the inputs for your own price data; the specimen data can be deleted. For small accumulation factors you don't really need to start with 40 rows of inputs, so you can modify to suit. As each new price bar opens in normal time you simply insert a new line below the last price line (ie the one above the grey zone), then copy and paste the last price line to this new line and adjust the time/price inputs accordingly.

You may also want to keep track of your equity in columns JK.

If you want to trade more than one market (not always necessary if you learn how to trade one market well), then simply copy/create a new worksheet and change the inputs accordingly.

It can also be converted into a testing platform by inserting/copying/pasting a greater number of lines. This is best done in Excel as it has a much quicker processing speed.

When the number of price lines becomes too cluttered on your screen/charts then just highlight the topmost price rows, right click, then click 'Hide' (click Unhide/Show to reverse this process).

A good way to start is to have it running in the background to your other trading activities, possibly trading daily prices on an index at a small to medium accumulation factor, small stake to begin with.

You can also practice the process on intraday data, paper trading or using very small stakes, so that you can become used to the system of making inputs and adjusting stops.

Watch out for 'outside days', they are the biggest curve balls, but in time you will find your way around them.

If you have any queries as to operation then please post.


View attachment 151216

Hi, Thanks for taking the time here. I have downloaded the form full of figures but as yet I cannot work out what the strategy is. I have found one strategy on binary options which I will try and it goes like this 1) look for a clear trend 2) then look for a stochastic on the 5 minute time frame which goes under the 20 line and then above with some separation for a long2) the 15 minute and the 1 hour trend and stochastic must be going in the same direction 3) only buy the option when there is less than say 25 minutes before expiry. With a set up like this of one per day and losing one in four, this should give a steady income. The problem with this strategy is finding the set up. Maybe it will occur once a day.

Regards

John
 
You can let the market come to you.

With the system you have quoted, by the time you can see a 'clear trend' you will have missed the trade.

Have a read through the earlier posts in this thread to get a feel for the INDE strategy, and you can always search the internet for more material on the INDE system of trading.

Post at any time if you need to run through anything.
 
Good Morning Polly

I have recently begun a thread on high probability credit stock option trading. I am looking for collaboratros, since in periods of low volatility I can not find sufficient trades that meet my rules. I assess all potential trades based on a number of individual metrics, and measure the effective annualized return of each completed trade as well as the portfolio in general based on annualized return, ie a trade that returns 21% of the margin requirement in 1/10 of a year has yieded a 210% return on an annualized basis.

What is the numerical result of your system by this measurement, over what time frame and with how many trades?

Drake
 
Hi Drake

The INDE system of trading is primarily a benchmark reference for new traders entering the market, setting out 'relative' probabilities for various standard indicators across various timescales. As such it doesn't generate the specific information that you seek, although could be modified to do so with it being spreadsheet based.

Just going off at a tangent, one of the first things a trader should do is learn to backtest properly, as there are so many flawed calculations out there. Once you know how to do this you begin to realise that it really is a fine line between profit and loss, but having said that it is not insurmountable and is a matter of practicing process so that your emotions have less influence on decision making.

In one way, it sounds as though your trading rules are serving you well, as in times of low volatility (presuming you mean little natural up/down movement) there is often little to trade, and these are the times when losses can accrue, and the knack is to keep these as small as possible. Remember that even day traders depend in part on the much longer wavelengths of trend, as it is the longer wavelengths which provide the most tradeable intra-day ranges.

In all cases, it is best to let the market come to you which, I agree, can be frustrating at times, but if you've backtested thoroughly then you know that your system will kick in again once the market moves back into major trend.
 
#2

So to consider three possibilities for data testing calculation:

1. The approach which incorrectly jumps the gun so to speak, and generally includes an amount of price movement which sits outside of the precise entry point. Let's call this 'falsetime'.

2. The approach which safely lags behind, by only including the price movement which occurs after the passing of the price bar containing the actual entry point. Let's call this 'safetime'.

3. The approach which reflects the actual amount of price movement which occurs within the precise crossing points. Let's call this 'realtime'.

The above words are cumbersome to understand alone so I've attached some illustrations of the six scenarios for the long and short entry calculations.

The corresponding exit calculations work on the same basis. Falsetime incorrectly reflecting an early exit, safetime a late exit, and realtime being the precise exit point.

View attachment 150158

View attachment 150160

View attachment 150162

View attachment 150164

View attachment 150166

View attachment 150168

Define your terms please, so that sense can be made of this thread.

What are P, L and S?
 
Hi Drake

The INDE system of trading is primarily a benchmark reference for new traders entering the market, setting out 'relative' probabilities for various standard indicators across various timescales. As such it doesn't generate the specific information that you seek, although could be modified to do so with it being spreadsheet based.

Just going off at a tangent, one of the first things a trader should do is learn to backtest properly, as there are so many flawed calculations out there. Once you know how to do this you begin to realise that it really is a fine line between profit and loss, but having said that it is not insurmountable and is a matter of practicing process so that your emotions have less influence on decision making.

In one way, it sounds as though your trading rules are serving you well, as in times of low volatility (presuming you mean little natural up/down movement) there is often little to trade, and these are the times when losses can accrue, and the knack is to keep these as small as possible. Remember that even day traders depend in part on the much longer wavelengths of trend, as it is the longer wavelengths which provide the most tradeable intra-day ranges.

In all cases, it is best to let the market come to you which, I agree, can be frustrating at times, but if you've backtested thoroughly then you know that your system will kick in again once the market moves back into major trend.


Polly, I would be interested in your participation in the High Probability Credit Trade thread if it ever gets off the ground. If there are a few seriously interested parties I will take some time to expand on what I am doing. While I have no effective means of backtesting, I not have about 450 trades using the system with the p/l, annual return and % win/loss data on the these trades. These were cash trades, not paper money.

Is this sufficiently different than what you are doing to prevent you from active participation?

At this juncture I am not going to pursue revisions, but as one of my earlier posts suggested I am just trying to sign up some additional monkeys for the team to pick up coconuts that are tough to find in the low volatility season.

Drake
 
Define your terms please, so that sense can be made of this thread.

What are P, L and S?

Mysteron

P = Crossing Point or Price
L = Long
S = Short

and

C[n] = Close of period n

The diagrams show typical short positions switching into typical long positions, and vice versa. I've tried to keep it as simple as possible, and appreciate your feedback to help bring further clarity.

The INDE benchmarking is based on continuous stop-and-reverse trading, and the INDE formula lends itself well to this being a 'raw' version of Wilder's Directional Indicators, which inherently include a reasonably gauged stop loss buffer. Minimum data sample is 10,000 periods.

The FALSEtime calculation is included, albeit a severely flawed calculation, to provide a frame for the REALtime calculation, which sits between the FALSEtime and SAFEtime calculations.

Unless someone can tell me otherwise, I suspect that most mainstream backtesting software with 'factory fitted' indicators does not exactly identify with the true crossing points, but sees when price triggers a change of position for any given indicator, and then takes the difference of the respective closing prices. In other words, the FALSEtime calculation is at play, without the user knowing this because the full code is hidden.

This is why I switched a long time ago from Metastock to a basic spreadsheet - so I could see the code in its entirety - otherwise you don't know what kind of bugs are flying about. I still use Metastock for the FALSEtime and SAFEtime generations, based on programming the outcomes beneath the main chart windows rather than using the backtesting function, but trade using a spreadsheet as it's easier to program the REALtime action and I can see each period unfold in greater detail.
 
Last edited:
Polly, I would be interested in your participation in the High Probability Credit Trade thread if it ever gets off the ground. If there are a few seriously interested parties I will take some time to expand on what I am doing. While I have no effective means of backtesting, I not have about 450 trades using the system with the p/l, annual return and % win/loss data on the these trades. These were cash trades, not paper money.

Is this sufficiently different than what you are doing to prevent you from active participation?

At this juncture I am not going to pursue revisions, but as one of my earlier posts suggested I am just trying to sign up some additional monkeys for the team to pick up coconuts that are tough to find in the low volatility season.

Drake

Drake

Thank you for your invitation but I'll not be able to dedicate the time required to do your system justice.

I used to scan everything that moved using a host of approaches and eventually decided to focus on one market in one timeframe using one indicator, and refining and simplifying this as much as possible before choosing to expand out again. It's taken me over 25 years since the age of 14 picking up Max Gunther's Zurich Axioms to get to this point, and now generally happy with the moderate approach I've developed as it gives me time for my other interests, which includes sharing what I know about the 'holy grail' (of which there are as many holy grails as there are traders).
 
Mysteron

P = Crossing Point or Price
L = Long
S = Short


and

C[n] = Close of period n

The diagrams show typical short positions switching into typical long positions, and vice versa. I've tried to keep it as simple as possible, and appreciate your feedback to help bring further clarity.
....

2wn79cw.png


OK so:

P = Crossing Point or Price

which is just a lable assigned to P with an 'x' on your diagrams, it doesn't explain the meaning, therefore define what P is please. How is it determined within the bar where the 'x' is?

Also you seem to be making a an assumption/restriction of being long OR short with no other state of being neither long or short, ie. not in the market = waiting for an opportunity.

Mysteron

SHORT ANSWER

P = The crossing point that an indicator (any indicator) switches from long-to-short or from short-to-long. They are idealised diagrams for the purposes only of showing the backtest calculation method, be it FALSEtime, SAFEtime or REALtime.

For the purposes of keeping the backtest calculations simple to start with, remembering that it is primarily for benchmarking only (ie relative performance), the INDE benchmark adopts a pure stop-and-reverse approach so that it is always in the market.

Once this benchmark is set, you can then gauge your chosen indicator/system against the INDE benchmark, hopefully surpassing it.

I'm not at all averse to having times when I'm out the market and no doubt in time I will also backtest long-short-out signals and dual timeframes and compare these against the INDE benchmark.

LONG ANSWER

It may be an idea to take a little step back.

The purpose of the diagrams is to show the action behind the creation of a benchmark, in this case the INDE benchmark. However, to create a benchmark you need to know where INDE formula sits amongst the standard indicators, simply to prove to yourself that your on the right track.

The INDE benchmark is based on pure stop-and-reverse trading, always being in the market - this does not mean that your chosen system has to be stop-and-reverse, but before using it you should first backtest to check that it surpasses the INDE benchmark - and to backtest you first need to reverse calculate your indicator formula to find the exact entry/exit points.

Now, the INDE formula is fairly straightforward to reverse calculate in terms of finding the crossing points because it is built on the accumulation technique (the same applies to any other indicator using the accumulation technique, eg most of Wilder's systems). To clarify, INDE is a 'raw' version of Wilder's Directional Movement System, similar to the Directional Indicators which are the calculations that are used by Wilder to arrive at the ADX.

Several of the standard indicators used in the benchmarking process are however built on moving average techniques which, compared to the accumulation technique, are relatively more difficult to reverse calculate so to find the exact crossing points (P). This is the reason for first identifying with the FALSEtime and SAFEtime scenarios, albeit they do not represent the exact entry/exit points generated by your chosen indicator (remember that the INDE 'indicator' is not put forward to say that it is better than all others, but to give a benchmark or reference point to gauge all others, be they better or not so).

The FALSEtime and SAFEtime (or REALtime) calculations therefore have no sway on the actual entry/exit points, but provide a frame in which all of the benchmarked indicators can be analysed in the first instance. This is a very important point and one often overlooked. If you are backtesting using pre-packaged software with hidden code, how do you know if it's properly representing the REALtime calculation, ie the one which actually happens in 'real life'.

In terms of producing backtest results, FALSEtime provides a wildly overstated expectation of return, and SAFEtime provides an understated expectation of return. In other words, if you gauged the performance of your chosen indicator/system on the back of the FALSEtime calculation then you will be severely disappointed in the outcomes when you come to live trade it. If you gauged the performance of your chosen indicator/system on the back of the SAFEtime calculation then you will be pleasantly surprised that your outcomes surpass your SAFEtime expectations. Remember that your actual entry/exit points are as calculated by your chosen indicator (be it RSI, INDE, moving averages, etc), which is separate to the FALSEtime, SAFEtime and REALtime calculations, which are provided purely to generate backtesting results.

The FALSEtime calculation therefore receives a red cross to indicate it is way off the mark to depend on it as a backtesting method, the SAFEtime one green tick to indicate it has promise, and REALtime two green ticks to indicate that this is the way you need to go, to zero in on and refine as much as possible (ie look to further develop the calculation to reflect trading costs and any other foreseeables that you may come across as you live trade, eg the effect of any 'outside day' movement when trading using a relatively small accumulation factor/lookback period).

The FALSEtime calculation does however have a saving grace, in that it provides a clearer differentiation of performance between indicators than the SAFEtime calculation. In other words, if you look at the below chart you can see that Wilder's RSI (lime line) provides the most impressive relative performance amongst all the other indicators, including INDE (blue line).
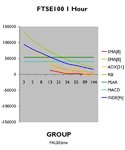
Group Ft Chart.jpg

Now, the RSI is one of Wilder's creations and so the accumulation technique is used in its calculation, which lends itself well to REALtime backtesting. Whilst the FALSEtime result is an overstated expectation we do know that the REALtime rankings will be ordered similar, and so this merits further investigation. I'm currently developing this now and looking to release some solid REALtime backtesting results by the end of the year.

No doubt the large financial houses already have this information, which they will have generated many moons ago, but the for retail trader it is long awaited.
 
Last edited:
Top