Calculating High Probability Trades

PollyM

Active member
Messages
195
Likes
7
On this thread I am going to start a series of posts which will discuss how to calculate high probability trades, so to give new traders a springboard into trading.

The aspects discussed will have a breadth of application, focusing first on learning how to trade one market well with small stakes, and building up from there.

I will look to post every weekday, although some days I’m away from the computer and this may not be possible, but will aim to keep a good rhythm going overall.

Some posts may be quite long, some quite short, depending on the time available. The sequencing of the posts may also be quite abstract at times, although any particular queries raised by reply will likely be answered over time as the posts unfold.

I have no idea at this stage how may posts there will be, but all basic aspects will be covered.
 
#1

For new traders, probabilities of outcome need to be mathematically analysed, as the learning of the art of trading is still in its very early stages. This mathematical assessment provides a glimpse behind the scenes so to speak, and helps to aid an understanding of how many of the classic trading techniques came to be.

So first we need to develop a testing framework which shows every mathematical step of the way. In showing every step of the way, this will boost your confidence in your chosen system.

When calculating the profit or loss of any given trade, we know that the precise entry and exit points rarely correspond to closing prices, but somewhere in between. I suspect that many testing systems give misleading results because they do not calculate these precise crossing points that are ‘somewhere in between’ but simply use closing prices as their reference points. This seemingly minor inaccuracy is sufficient shift a supposedly profit-making market into a woefully loss-making one for any given set of trading rules.

Most testing systems are pre-packaged and you cannot see the coding of the calculation. For our purposes, we therefore need to start afresh with a new testing system written on a spreadsheet. This way we can see every single event happening in sequence.
 
c'mon Polly ..............

this is a good start but call us a trade, they'll all be asleep before the 3rd post ! :cool:

N
 
#2

So to consider three possibilities for data testing calculation:

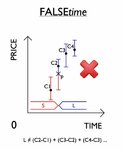
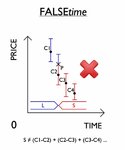
1. The approach which incorrectly jumps the gun so to speak, and generally includes an amount of price movement which sits outside of the precise entry point. Let's call this 'falsetime'.

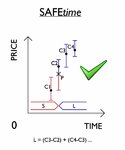
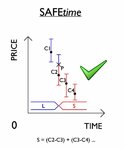
2. The approach which safely lags behind, by only including the price movement which occurs after the passing of the price bar containing the actual entry point. Let's call this 'safetime'.

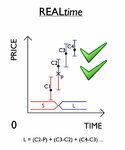
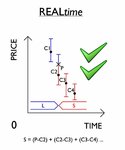
3. The approach which reflects the actual amount of price movement which occurs within the precise crossing points. Let's call this 'realtime'.

The above words are cumbersome to understand alone so I've attached some illustrations of the six scenarios for the long and short entry calculations.

The corresponding exit calculations work on the same basis. Falsetime incorrectly reflecting an early exit, safetime a late exit, and realtime being the precise exit point.

longfalsetime.jpg

shortfalsetime.jpg

longsafetime.jpg

shortsafetime.jpg

longrealtime.jpg

shortrealtime.jpg
 
#3

On the face of it, it seems pointless to even consider the falsetime (Ft) and safetime (St) calculations when it is obvious that the realtime (Rt) calculation is the one which happens in actuality. However, once you begin to try to mathematically construct a Rt calculation for any trading system or indicator which uses averaging techniques, you begin to realise that it is not straightforward, as essentially you have to try to deconstruct the averaging calculations. The trading systems or indicators which lend themselves better to the Rt calculation are those which use an accumulation technique.

The Ft and St calculations are therefore employed in the beginning so that we can compare the relative performances of a wide range of trading systems or indicators, whether they employ averaging or accumulation.

For me, the swiftest way I've been able to arrive at the Ft and St numbers is by using the metastock software I used for a number of years before switching to spreadsheet.

Metastock contains a host of traditional indicators already preprogrammed, ready for inserting into trading systems. A little user programming then enables Ft and St calculations to be generated.

The basic trading systems we are going to analyse in the coming posts include:

1. SMA (simple moving average crossover).
2. EMA (exponential moving average crossover).
3. ADX (average directional index).
4. RSI (relative strength index).
5. PSAR (parabolic stop and reverse).
6. MACD (moving average convergence divergence).
7. INDE (increment decrement).

For the different variable settings we can insert numbers from the Fibonacci sequence, as these provide a well-balanced numerical progression.
 
#4

Before we start to look at any numbers and relative performance, I can say now that we will see there is little fundamental difference in performance calculations across most of the indicators and trading systems. This is not unsurprising as they are all built on rate of change (roc). The two exceptions to this are MACD and PSAR which are applied across the board with their default settings.

It is therefore your choice which indicator or trading system you apply, this ideally being the one you feel most comfortable with.

As we move through you will also begin to see why some trading systems fall down and do not seem to fulfil the promise which they show on initial testing. It is to do with the stop loss calculation which, for the purposes of our calculations, is essentially the crossing point when long switches to short and vice versa.

Trading systems which purely use the single input of the current price in their calculation fall into this trap, as the nature of their calculation means that, in real life, a separate framework is required to be added on for the actual stop loss, and this, practically most of the time will vary from the actual crossing points which can be seen in hindsight once the trade opportunity has passed.

Think about it. If you didn't have a separate stop loss method then you would be repeatedly going long-short-long-short-long-short-etc as the price wavered around the actual crossing point for a certain amount of time. However, once you apply a separate stop loss method you begin to complicate the testing calculation as you need to introduce additional formulae.

Notwithstanding this 'current price quandary', we shall proceed to look at the performance of the various indicators and trading systems.
 
interesting

so you are proposing a delayed (slower) signalling system to incorporate the inevitable chop we see when entering/exiting Trades to early ?

and your premise is based on a trader always losing out (in the long run) on trades by entering some to early ?

thats great as long as the "price gap" you are charging to purify the signals creates more profitability ( in the long term) than the losses incurred by simply entering / exiting earlier

the bigger the Price gap you charge - the less effective the system is

good thread !
N
 
Last edited:
#5

The market data which we are going to analyse for this exercise is the FTSE100 1 Hour main market from 2006 to 2012. For the purposes of these calculations, the sample size should be at a minimum 10,000 periods (in this case nearly 12,000), so to allow all market wavelengths a free play, and avoid any so-called 'curve fitting' doubts.

Any data can be used, this is not the important part for the moment, the crucial aspect is currently the development of a thorough understanding of the processes and relativities involved.

The numbers are based how many points any particular system embraces in both long and short positions, so in a sense if you are for example on a spreadbetting platform, it is the equivalent of your stake being £1 a point. Again, it is the process that is important to understand at the moment, not the stake size, as this can be adjusted to suit your circumstances at a later date.

For the moment the calculations do not include trading fees/spread, which will be brought in later once we have made some basic or 'raw' comparisons across the board.

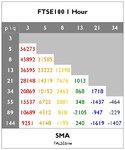
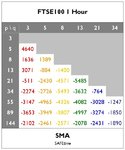
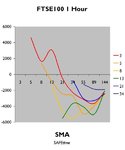
We start with the SMA crossover system, where we have two simple moving averages, a slow (p) and a fast (q) output, which signal long and short positions when they crossover.

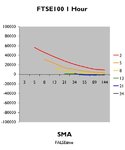
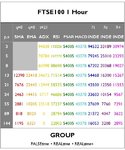
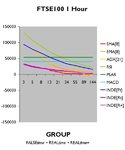
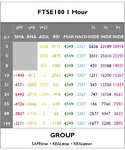
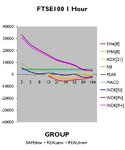
The attached matrices and spaghetti charts show the Ft and St results at different settings.

As expected, Ft generates overly optimistic results which are physically impossible to achieve for any given set of trading rules, and St provides very understated outcomes, which waver around the break-even line, relatively speaking.


SMA Ft Matrix.jpg

SMA Ft Chart.jpg

SMA St Matrix.jpg

SMA St Chart.jpg
 
#6

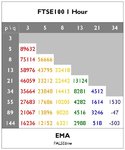
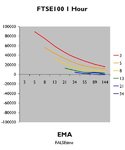
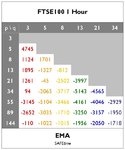
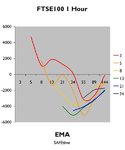
And so moving on to the EMA crossover outputs which are attached.

Again, similar characteristics are seen, with the exponential aspect of the moving average calculations showing a degree of improvement on the SMA, particularly in falsetime.

EMA Ft Matrix.jpg

EMA Ft Chart.jpg

EMA St Matrix.jpg

EMA St Chart.jpg
 
#7

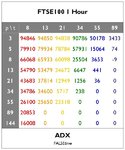
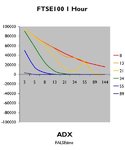
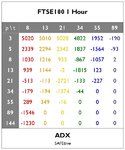
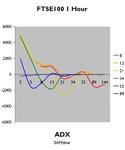
The next trading system is the ADX which, for our calculation purposes, applies the same period setting 'p' across the three +DI, –DI and ADX components, with the +DI/-DI trade signals being activated when the ADX reaches and rises above a set threshold, this threshold being the second variable 't'.

The nature of this trading system means that you are sometimes out of the market, that is, when the trend strength as signalled by the ADX is below the chosen trend threshold.

The below charts show the Ft and St outcomes.

I should mention at this stage that the ADX trading system does not experience the 'current price quandary', as its reference points for calculation are high and low prices, which give a twin stream +DI/-DI output that produces long-short signals on crossover. At all times there is a flexible core price range which exists between the long and short entry/exit points, which provides a buffer zone for the usual oscillations experienced around the precise crossover points in the very short-term. The ADX also utilises an accumulation technique.

The ADX is a feature of the Directional Movement System originated by Wilder in his 1970s book New Concepts In Technical Trading Systems, and is a worthwhile read for new traders.

ADX Ft Matrix.jpg

ADX Ft Chart.jpg

ADX St Matrix.jpg

ADX St Chart.jpg
 
Hi PollyM,

I find these posts interesting, and I appreciate how much time it must have taken for write these. I have a very basic question:

What do you consider to be a "high probability trade"?

Thanks,
 
Is this thread entirely about the age old problem of trade location vs trade confirmation?

i.e. the more confirmation you wait for, the further price has moved away and therefore the lower the profit opportunity

As you appear to be using indicators which are derivatives of price, they will always lag price and therefore reduce the profit opportunity.

Interesting though, especially the way you have modelled it.
 
I directed my question to PollyM, but if anyone can answer it, I would appreciate it greatly. thanks,
 
Hi PollyM,

I find these posts interesting, and I appreciate how much time it must have taken for write these. I have a very basic question:

What do you consider to be a "high probability trade"?

Thanks,

holmes16

Keep reading and we will get there.

PollyM
 
Is this thread entirely about the age old problem of trade location vs trade confirmation?

i.e. the more confirmation you wait for, the further price has moved away and therefore the lower the profit opportunity

As you appear to be using indicators which are derivatives of price, they will always lag price and therefore reduce the profit opportunity.

Interesting though, especially the way you have modelled it.

robster970

If a benchmark can be established based on trading price alone then this will help new traders objectively gauge the characteristics of other trading systems.

PollyM
 
#8

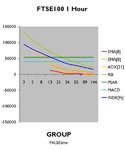
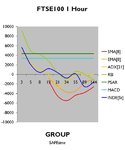
The attached charts show the Ft and St results for the remaining trading systems of RSI, PSAR, MACD and INDE, together with selected outcomes for SMA, EMA and ADX extracted from the above matrices and charts.

The RSI system chosen for this analysis is a simple crossover at the central 50 line.

The PSAR and MACD trading systems are as set out by Wilder and Appel respectively, keeping with their default settings across the board.

The INDE trading system is a simplified version of the Directional Movement System, stripped back to its bare essentials, similar to the +DI/-DI crossover signals. As with ADX, it also uses the accumulation technique.

The matrices corresponding to the attached charts will be presented in the next post, where we will get our first insight into the realtime calculation, that is, the actual returns that you would expect to experience as you follow the exact trading signals outputted by your chosen platform, both before and after trading costs.


Group Ft Chart.jpg

Group St Chart.jpg
 
#9

The attached matrices show the Ft and St results across all the trading systems, and correspond to the charts attached to post #8 above.

Also presented are two realtime calculations, Rt being the basic or raw realtime calculation before trading costs (eg spread), and R+ being the realtime calculation once the spread ‘cost’ of each and every trade is taken into consideration.

In this case the trading cost equates to a typical FTSE100 spread on a retail spreadbetting platform, again so to seek the worst case scenarios in this analysis. For our calculations, the spread ‘cost’ is set at 1 point. Any finance charges for rolling over any positions are not included in these calculations, but they are generally negligible relative to spread.

The accumulation technique used in the simplified INDE trading system allows the accurate calculation of the realtime returns for each accumulation factor setting. This is constructed on a spreadsheet to enable each trade to be revealed every step of the way. Similar results for realtime could also be outputted for ADX with a little adjustment to the spreadsheet formulae, although this becomes increasingly more challenging to construct for those trading systems which employ moving average techniques (eg SMA, EMA, MACD).

It is not that the accumulation technique is a more advanced method of calculation than moving averages, albeit having an inherent smoothing action, it is just easier to deconstruct when you’re looking to recreate or walk through possible scenarios.

Wilder often employs the accumulation technique in the calculations documented in his book New Concepts In Technical Trading System, and this is a good introduction for any new traders interested in learning more about it.

The overlaying of the Rt and R+ outputs on both the Ft and St charts helps to reveal the actual order of events, with the Ft expectations being shown to be generally overstated or over-optimistic, and the St expectations being shown to be generally understated or under-optimistic.


Group FtRt Matrix.jpg

Group FtRt Chart.jpg

Group StRt Matrix.jpg

Group StRt Chart.jpg
 
#10

Rt and R+ are the ‘somewhere in between’ propositions mentioned in post #1 above, which have now been mathematically reconstructed when applied to historical data.

This degree of validation establishes a preliminary benchmark and helps to provide an impetus for further analysis and empirical testing through live trading.

Taking a moment to reflect on the characteristics of the mathematical results, they broadly show us a range of profitable pathways, as well as relatively thorny ones. In other words, it can be said they show us the high probability trade routes, as well as the low probability ones.

The referencing of trade probabilities will vary according to the framework with which you choose to trade. In this case, where the adopted framework focuses on trading one market constantly, the assessment of probabilities is seen to be a relative proposition*.

For example, you can say that trading the FTSE100 1 Hour at an accumulation factor of 3 has a higher probability of profit growth than trading the FTSE100 1 Hour at an accumulation factor of 21. And trading the FTSE100 1 Hour at an accumulation factor of 21 has a higher probability of profit growth than trading the FTSE100 1 Hour at an accumulation factor of 144.

In calculating ‘high probability trades’ within this framework you are therefore first calculating probability pathways across time. Along the relatively higher probability pathways, all of the trades nestled within the particular trading system you choose to adopt are essentially by definition ‘high probability trades’, whether or not individually they yield a profit or a loss.

It is the cumulative result which matters, not how many trades are profit making and how many are loss making, as you will find that to seek a positive cumulative result through constant trading you will experience a mix of everything. It confirms that within such a framework where you are not trading ‘blind’, there is simply no need to attach yourself to having to make every single trade a profit making one, as you know that over time the results will on balance produce a rising equity curve. In other words, you are trading with foresight, not hindsight.

That brings to an end this series of posts on ‘calculating high probability trades’. I have some other ideas for further posts and may return with these in the future.

*If you choose to trade by an alternative method, say by seeking out set pieces instead of trading the open play, then this would require a different and more complicated method of assessment altogether.
 
This is an interesting thread. Every trader is interested in getting a better trade. Have you considered using Bayesian inference with Markov Chain Monte Carlo Simulation methods applied to short time series to forcast future volatility.

There is a lot of research going on in that area and as traders are primarily interested in the short term and probably only have access to short term data: up to 5 years, this might be a fruitful way to go.
 
Top