CostaKapo
Active member
- Messages
- 164
- Likes
- 12
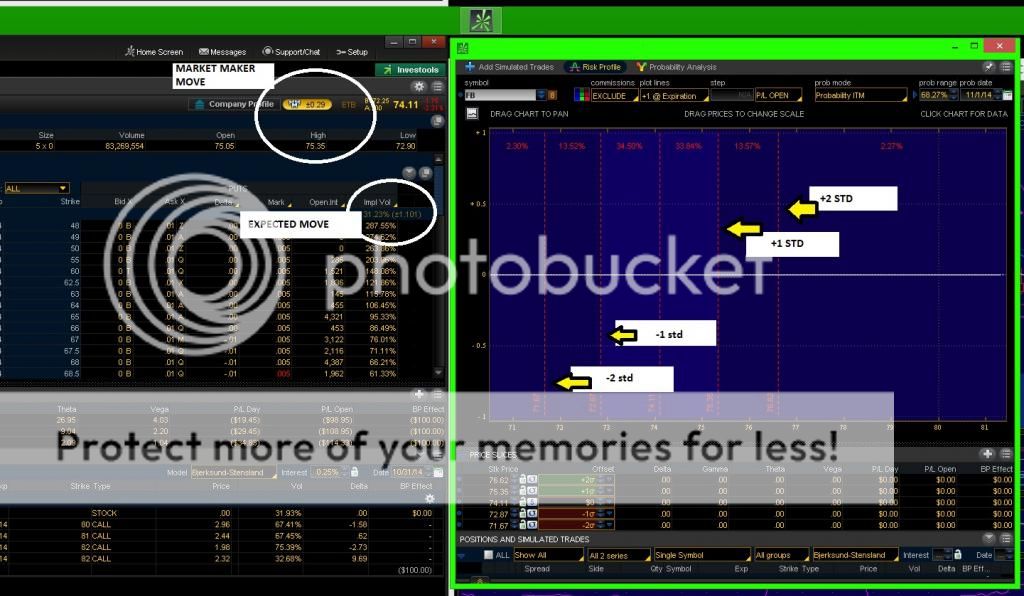
With binary events such as earnings or FOMC etc. options traders have been calculating the expected move based on the idea that markets are efficient and pricing is always accurate.
Start with the at-the-money strike price for the options in question (these are the options that expire just after earnings). Now, take the price of the at-the-money call and the at-the-money put and add them together (this is called the at-the-money straddle). Next, take the price of the call with the next highest strike price (out-of-the-money) and the price of the put with the next lowest strike price (out-of-the-money). Add them together, and you have an out-of-the-money strangle.
Last, add the prices of the at-the-money straddle (call + put, same strike price) and the out-of-the-money strangle (call + put, one strike out-of-the-money) and divide by two (you’ve taken an average). This is the amount that the market expects the stock to move up OR down by options expiration, and is a reasonable guess at the expected earnings move (the earnings move is likely expected to be a little less than this if there is time between the earnings release and expiration).
So add the average to the current stock price, then subtract it, and consider that range your “one standard deviation” range - this just means that, about 68% of the time, the stock will finish earnings within this range.
This being said I would like to see about creating an excel sheet that is constantly updating itself based on these parameters. I am not that well versed in excel, so if someone could - please let me know if this is possible. :smart:
via http://pfd.me/2014/10/27/expected-move-calculation-binary-events-like-earnings-for-options-traders/

