Background
Recall that the theory behind technical analysis states that financial charts take all things into account – that is, all fundamental and environmental factors. The theory goes on to state that these charts display elements of psychology that can be interpreted via technical indicators.
To better understand this, let's look at an example. Fibonacci retracements are derived from a mathematical sequence: 1, 1, 2, 3, 5, 8, 13 and so on. We can see that the current number is the sum of the previous two numbers. What does this have to do with the markets? Well, it turns out that these retracement levels (33%, 50%, 66%) influence traders' decisions to such an extent that the levels have become a set of psychological support and resistance levels. The idea is that, by finding these points on charts, one can predict the future directions of price movements.
Components of an Indicator
All indicators are created to predict where a price is likely to head when a certain condition is present. Traders try to predict two basic things:
- Support and resistance levels: These are important because they are the areas at which prices reverse direction.
- Time: This is important because you need to be able to predict when price movements will occur.
Occasionally, indicators predict these two factors directly – as is the case with Bollinger Bands or Elliott's Waves – but indicators commonly have a set of rules enacted in order to issue a prediction.
For example, when using the breadth thrust indicator (which is represented by a line indicating momentum levels), we need to know which levels are relevant. The indicator itself is simply a line. The breadth thrust indicator looks similar to RSI, in that it is "range-bound," and it is used to gauge the momentum of price movements. When the line is in the median zone, there is little momentum. When it rises into the upper zone, we know that there is increased momentum and vice versa. One could look to take a long position when the momentum is on the rise from low levels and look to short after the momentum peaks at a high level. It is important to set rules to interpret the meaning of an indicator's movements in order to make them useful.
With this in mind, let's look at ways of creating predictions. There are two main types of indicators: "unique" indicators and "hybrid" indicators. Unique indicators can be developed only with core elements of chart analysis, while hybrid indicators can use a combination of core elements and existing indicators.
Components of Unique Indicators
Unique indicators are based on inherent aspects of charts and mathematical functions. Here are two of the most common components:
- Patterns
Patterns are simply repeating price sequences apparent over the course of a given time period. Many indicators use patterns to represent probable future price movements. For example, Elliott Wave theory is based on the premise that all prices move in a certain pattern. A simplified example is shown in Fig 1:
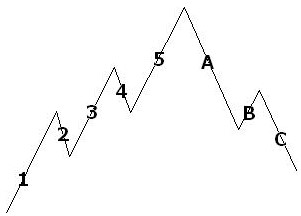
Fig 1 - An Elliot Wave Pattern
There are many other simple patterns that traders use to identify areas of price movement within cycles. Some of these include triangles, wedges, and rectangles.
These types of patterns can be identified within charts simply by looking at them; however, computers offer a much faster way to accomplish this task. Computer applications and services provide the ability to automatically locate such patterns.
- Mathematical Functions
Mathematical functions can range from price averaging to more complex functions based on volume and other measures. For example, Bollinger Bands are simply fixed percentages above and below a moving average. This mathematical function gives a clear price channel showing support and resistance levels.
Components of Hybrid Indicators
Hybrid indicators use a combination of existing indicators and can be thought of as "simplistic trading systems". There are countless ways in which elements can be combined to form valid indicators. Here's an example of the MA crossover:
This hybrid indicator utilizes several different indicators including three instances of the moving averages. One must first draw the 3-day, 7-day and 20-day moving averages based on the price history. The rule then looks for a crossover in order to buy the security or a cross-under in order to sell. This system indicates a level at which price movement can be expected and provides a reasonable way to estimate when this will occur (as the lines draw closer together). Here's what it might look like:
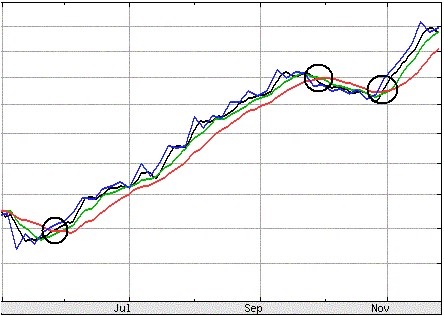
Fig 2 - A Moving Average Crossover - Source: Yahoo Finance
Creating an Indicator
A trader can create an indicator by following several simple steps:
- Determine the type of indicator you wish to build: unique or hybrid.
- Determine the components to be included in your indicator.
- Create a set of rules (if necessary) to govern when and where price movements should be expected to occur.
- Test your indicator in the real market through backtesting or paper trading.
- If it produces good returns, put it into use.
An Example
Suppose we want to create an indicator that measures one of the most basic elements of the markets: price swings. The goal of our indicator is to predict future price movements based on this swing pattern.
Step 1:
We look to develop a unique indicator using two core elements, a pattern and math functions.
Step 2:
Looking at weekly charts of company XYZ's stock, we notice some basic swings between bullishness and bearishness that each last about five days. As our indicator is to measure price swings, we should be interested in patterns to define the swing and a mathematical function, price averages, to define the scope of these swings.
Step 3:
Now we need to define the rules that govern these elements. The patterns are the easiest to define: they are simply bullish and bearish patterns that alternate every five or so days. To create an average, we take a sample of the duration of upward trends and a sample of the duration of downward trends. Our end result should be an expected time period for these moves to occur. To define the scope of the swings, we use a relative high and a relative low, and we set these at the high and low of the weekly chart. Next, to create a projection of the current incline/decline based on past inclines/declines, we simply average the total inclines/declines and predict the same measured moves (+/-) occur in the future. The direction and duration of the move, again, is determined by the pattern.
Step 4:
We take this strategy and test it manually, or use software to plot it and create signals. We find that it can successfully return 5% per swing (every five days).
Step 5:
Finally, we go live with this concept and trade with real money.
In Summary
Building your own indicator involves taking a deeper look into technical analysis and then developing these basic components into something unique. Ultimately, the aim is to gain an edge over other traders. Looking at Ralph Nelson Elliott or W. D. Gann, their successful indicators gave them not only a trading edge but also popularity and notoriety within financial circles worldwide.
Justin Kuepper can be contacted at Internationalinvest