Hi Guys,
I am building a scanner for US stocks. I have finished it for 90% and I am getting great results.
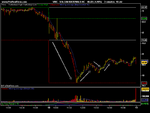
But I am still looking for an indicator I can use to find stocks that have smooth charts (the flow in price looks nice and readable with hardly any choppiness)). Just like NTRS near the end of the trading day on friday.
I trade break out and break down set ups with a min daily vol, min today's vol, within a certain price range, MA's and ATR's.
I hope some of you can show me the right direction and of course the right indicator.
Kind regards,
Thevinman
I am building a scanner for US stocks. I have finished it for 90% and I am getting great results.
But I am still looking for an indicator I can use to find stocks that have smooth charts (the flow in price looks nice and readable with hardly any choppiness)). Just like NTRS near the end of the trading day on friday.
I trade break out and break down set ups with a min daily vol, min today's vol, within a certain price range, MA's and ATR's.
I hope some of you can show me the right direction and of course the right indicator.
Kind regards,
Thevinman