Build Neural Network Indicator in MT4 using Neuroshell

Here you have NSDT chart with Fisher indicator and my predictions, fisher dll for NSDT and fisher indicator for MT4. Chart is openable with NSDT 5.6 or higher.

Krzysztof
 

Attachments

  • FISH.zip
    1.4 MB · Views: 536
Kryzs,

To open in NSDT need SAK.dll required for Ehler's Fisher and Ehler's Swiss Army Knife indicators. Would you please provide this one.

Arry
 
Multimarket Analysis ?? Is it bull**** ??

Look at this. Contradicts with idea of MM analysis

3.3 Effect of Network Parameters
The parameters that must be chosen for the neural networks
are the number of layers in the network and the number
of neurons in each layer. Note that the number of neurons
in the input layer is the choice for the number of price
return inputs given to the network (minus one for the recurrent
input.) Examining tables 1 and 2, one of the most striking
results of this study is that a neural network with a single
layer outperforms a neural network with two layers. This
may seem like a surprise because 2 layer networks are generally
a more powerful learning model; a single layer neural
network can only make decisions that are linearly separable
in the space of the inputs [5]. However, the high level
of noise in financial data may make the learning ability of
the two layer network a liability if it memorizes noise in the
input data. On the other hand, this result seems to imply
that reasonably good trading decisions for FX markets are
in some sense linearly separable in the space of the recent
price returns and therefore not as complex as we may believe.
Figure 2 shows the effect of the number of price return
inputs on the performance of a single layer neural network
trader. The results shown for three currency markets display
the difficulty of choosing fixed parameters for neural
network currency traders.
While the trader performs best in the Australian Dollar -
US Dollar (AUD-USD) market with fewer inputs, its performance
in the - Dollar - Dutch Guilder (USD-NLG) market
is best with a larger number of inputs. In the GBP-USD
market performance is best at fewer inputs, but the worst
performance is for traders with an intermediate number of
inputs. This seems to defy common sense, yet the the result
is a genuine quirk of the market. The final number of
price inputs that was chosen to optimize the average performance
in the tuning markets was 4. This results is also
rather surprising because it means that the neural network
traders only need the price returns from the most recent two
hours in order to make effective trading decisions.
Comparing the profit with the Sharpe Ratio for the currency
markets in figure 2 shows that there does not appear
to be a tradeoff between profit and stability of returns when
choosing the optimal values for the fixed parameters of the
model. The number of inputs that has the highest profit has
the highest Sharpe Ratio as well. This was true for nearly
all of the fixed parameters and currency markets.
 

Attachments

  • Gold[2003] - FX Trading via Recurrent Reinforcement Learning.pdf
    171.3 KB · Views: 4,676
Last edited:
page 103 Neural Network in Finance Paud D. McNelis

Walczak (2001) has examined the issue of length of the training set or
in-sample data size for producing accurate forecasts in financial markets.
He found that for most exchange-rate predictions (on a daily basis), a
maximum of two years produces the “best neural network forecasting model
performance” [Walczak (2001), p. 205]. Walczak calls the use of data closer
in time to the data that are to be forecast the times-series recency effect.
Use of more recent data can improve forecast accuracy by 5% or more while
reducing the training and development time for neural network models
[Walczak (2001), p. 205].
Walczak measures the accuracy of his forecasts not by the root mean
squared error criterion but by percentage of correct out-of-sample direction
of change forecasts, or directional accuracy, taken up by Pesaran and
Timmerman (1992). As in most studies, he found that single-hidden-layer
neural networks consistently outperformed two-layer neural networks, and
that they are capable of reaching the 60% accuracy threshold [Walczak
(2001), p. 211].
 
Kryzs,

What do you think about the following result compare to the original NSDT prediction?

See in brief the form of prediction compare to my new indicator. I created an indicator from NSpred based on your data. In order can be used for new data i should get your indicators and I can give you my indicator dll as well, if you would. Please send me to my email.

Arry
 

Attachments

  • Full report using NS2 for 6k.pdf
    416.8 KB · Views: 419
  • range indicator.png
    range indicator.png
    19.9 KB · Views: 702
  • zoom indicator 6k.png
    zoom indicator 6k.png
    35.9 KB · Views: 542
Refer to your post #144-145, you can download Alyuda NeuroIntelligence trial version, there are some advantages:
- automatic performing anaylisis input file and extracting into training, cross validation and test set
- on the network design, it possible to find the architecture searching such as NN configuration, number of weight, number of neurons etc. Maximum only search up to 5 layers prior optimizing. it produces the 5 highest optimum NN architecture that we can choose afterward.

Disadvantages:
- limited architecture, i.e only feed forward back propagation. No more else such as recurrent, jump, PNN, RBF etc. I am not sure if it can be used for classification problem.
- only assign one activation function for all hidden layers
- the trial version only applicable for max 2000 bars data, an can not more than 20 inputs.

Hope the next version of this software may solve the NN architecture selection problem.
Arry
 
you mean you want Fisher Price indicator ?? But i thought you have it once you open the chart. It should be imported
 
Looking to you report, you took sligthly different number of bars than fixed values found during optimization of my prediction and train it again. OOS results seems very good. Correct sign much higher. Interesting if this improvement is real.....are you sure that there is no overlapping of ranges and in this case future leak ???
 
I do not think so, refer to page 2 I split the row data for training (7004 bars) and applying/out of sample (1126 bars) as your original prediction. On the page 4 for the training bars and page 5 to implement the trained net on out of sample data.

I think should no more leak..hence we should test it on real time walk forward data

Arry
 
I think we should find the answer first if really multimarket analysis improves results and then is it true that the most efficient is one layer net and than how to preprocess the data.

Those answers we can only find making by multiple tests on different data sets with OOS test. I will start with 15-30-10-1 net which was the best, change the configuration to lets say 15-30-1 training using CUDA and see the results.

I understand that OOS error on 15-38-38-1 data was like 19 pips ??? Is is correct ??? Maybe you will try to improve it ?
 
I do not think so, refer to page 2 I split the row data for training (7004 bars) and applying/out of sample (1126 bars) as your original prediction. On the page 4 for the training bars and page 5 to implement the trained net on out of sample data.

I think should no more leak..hence we should test it on real time walk forward data

Arry

yes we must check it on unseen data. You can make 'format chart' in NSDT and cut like 8-9k latest bars and we will see.

Krzysztof
 
Re: Multimarket Analysis ?? Is it bull**** ??

Look at this. Contradicts with idea of MM analysis
Man, you guys move fast. I turn my head for a minute and I lose track:)

My comment on the paper from CalTech:

Multi-markets may be BS, but I'm not sure this paper can be used as evidence. I have to read it again, but their results seem consistent with what Mendelsohn claims. Different markets are better predicted with different inputs. e.g. CHF and Gold might help to predict the price of the EUR, but you might need USD and Oil to predict the price of the GBP. These guys seem to try to find a single network model that works for all FX pairs. I think that means the same inputs, and same learning parameters. I guess that if successful, that might increase your confidence, but given that currencies have varying characteristics, like volatility and to some extent spectrum, and that some currencies are correlated with others, I would not expect a single model to work as well as a set of models each tuned to the pair it will work with.

This doesn't mean that I believe in multi market models, but I think it may be too early to throw them out. Not much else seems to work well.

Now to go back and see what you're doing.
fralo/MadCow
 
Re: Multimarket Analysis ?? Is it bull**** ??

Man, you guys move fast. I turn my head for a minute and I lose track:)

My comment on the paper from CalTech:

Multi-markets may be BS, but I'm not sure this paper can be used as evidence. I have to read it again, but their results seem consistent with what Mendelsohn claims. Different markets are better predicted with different inputs. e.g. CHF and Gold might help to predict the price of the EUR, but you might need USD and Oil to predict the price of the GBP. These guys seem to try to find a single network model that works for all FX pairs. I think that means the same inputs, and same learning parameters. I guess that if successful, that might increase your confidence, but given that currencies have varying characteristics, like volatility and to some extent spectrum, and that some currencies are correlated with others, I would not expect a single model to work as well as a set of models each tuned to the pair it will work with.

This doesn't mean that I believe in multi market models, but I think it may be too early to throw them out. Not much else seems to work well.

Now to go back and see what you're doing.
fralo/MadCow

I quite agree with you, Fralo. These guys DO move fast. Very active thread and hope it leads somewhere profitable.

As for Multi-Market, the data and analysis will lead the way. In my mind, it's absurd to conceive of a "one size fits all" algorithm for all pairs. Beyond that, EU and GU are frequently far more manipulated by forces outside of the free market. That has to skew results. On EU last year, I sat and watched the M1 as it rocketed 200 pips in a single candle, and that was outside of any "News" event. Blew my mind. Took several hours to find any mention of 'the rumour' which supposedly triggered that event so, obviously, it was not something generally known. Insiders made a bundle, no doubt.

I'm not sure any NNet config would recognize or cope with those moves. Random rumours are tough to handle and, I believe, unpredictable. Yet, they live within our data streams.

Quite a lot of profit to be pulled out of the market safely trading non-manipulated pairs, imo.

Keep up the great work, gents.

Best,
Merlin
 
Fralo,

Where is "paper from CalTech" ? I should read it.

Here are my personal opinion.

For me the basic idea is always same: "NN prediction result will depend only from the inputs NN given for training, some peoples expecting NN to give the best result but they never trained the NN comprehensively". If we train an NN with a, b, c to resulting 0 or 1, NN can not work for input d or e or generate output 2, except we do some preprocessing to generalize inputs.

1. Input data
If assumed that EURUSD price will be affected by CHF, Gold, or even fundamental news. Feed them into NN as inputs for the net training. The key is how identify which factors will effect to the predicted value and how to make all data available for NN training.

2. Data preprocessing
I have seen that from data preprocessing especially on NS, it use max/min and std dev value to limit the input and output range. Example, if during training the input/output data used only within 0.8 to 1.4, we can not expect the NN to work properly if the input range is change to 1.3 to 2.5.

3. NN Design: what/how may inputs, output, NN architecture, weight updating method, acceptable criterion or event software used to train the network.

4. Firing up the trained net back into the real problem. So many choice foreseen: using excel, direct to MT4/NSDT or other charting software.

5. Generate the trading signal with the NN...

If we failed to perform all above steps, profitable trade still not possible even in our dream....

SO...I can't expecting my profitable trade if I am still finding which inputs for my NN, or collecting them, or struggling to find the best NN architecture or even the NN software to train my NN...:( quite long journey..

regards,
Arry
 
Caltech paper - post 144. But the results are related to reinforced learning.

I believe there is a lot of myths and biased opinion which are flying around, market is changing all the time and those opinions have big inertia till they get changed. So till we dont check we will not know !!! I'm just trying to find out if MM analysis is better than NN trained on single data.....

So for example if my prediction for EURUSD 1m was giving correct sign sligthly above 50% than MM should give in my opinion like a 60% to be proven that its valuable method. Training and test should be done of course on reasonable big sample size to avoid false results.

There is this data in Arrys report from Predictor but correct sign is 100% there...to good to be true...and NS2 dont give the correct sign...

Krzysztof
 
Last edited:
Fralo,

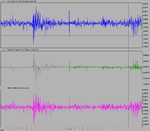
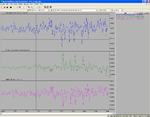
Here is the NS2 output file, it includes all train and test patterns, including actual, prediction and their differences.

Kryzs, you can verify with the output data to calculate your MSE or RMS. I just shown the actual result..without any adjustment..

Arry

Arry,

Is this sheet correct ?? Actual output should be H i think, this what we predict based on
H-1(one bar to the future). Instead actual output is H-1 ??

Krzysztof
 
Here are two nets from MBP trained with CUDA for 150 000 epochs with configuration
15-30-10-1 and 15-30-1. Objective was to check the impact of additional layer of neurons.

There is also excel sheet which calculates absolute error, stdev and correct sign for those nets. Clearly adding extra layer of neurons introduces stronger error level.
I believe we can try to extend functions of this sheet to make deeper analysis of nets.

Pass is the same what Arry is using in his PDFs.

Im training now configuration 15-30-30-1 to confirm impact of additional layers.
Perhaps arry you can use this sheet to calculate correct sign of NS2 and Predictor nets
because this what is shown in your report is impossible. Just have a look how i did it and double check it of course.

Krzysztof
 

Attachments

  • 15-30-xx.zip
    1.6 MB · Views: 281
Here are two nets from MBP trained with CUDA for 150 000 epochs with configuration
15-30-10-1 and 15-30-1. Objective was to check the impact of additional layer of neurons.

There is also excel sheet which calculates absolute error, stdev and correct sign for those nets. Clearly adding extra layer of neurons introduces stronger error level.
I believe we can try to extend functions of this sheet to make deeper analysis of nets.

Pass is the same what Arry is using in his PDFs.

Im training now configuration 15-30-30-1 to confirm impact of additional layers.
Perhaps arry you can use this sheet to calculate correct sign of NS2 and Predictor nets
because this what is shown in your report is impossible. Just have a look how i did it and double check it of course.

Krzysztof
Can you convert the zipped xlsx file to xls? Excel 2003 can't read it, and I don't want to give Bill Gates any more cash.:)

Also I suggest that your idea to look at sign matching rate is better way to evaluate nets/inputs, so perhaps we should
start including this measure with rmse. The rmse reported by MBP does not change much from topology to topology.
It might be that sign matching is more sensitive?
Madcow
 
Last edited:
I hope it will work. I used COUNTIF which is new but it said that it is converted.
 

Attachments

  • 15-30-xx-report.zip
    1.3 MB · Views: 220
Top