Build Neural Network Indicator in MT4 using Neuroshell

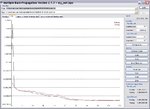
I'm not sure what's going on there Krzys, MBP will not give the same results every time you train a net, but in my experience they are not usually that different. Did you start with randomized weights? (See the FAQ at http://dit.ipg.pt/MBP/FAQ.aspx). Sometimes it gets stuck in a local minimum, but I have repeated the training several times and always get roughly the same result.RMS error ~ 0.005. Here is another image of another training run starting with randomized weights.
View attachment 77492

The bugs reported on the MBP site suggest that when you use CUDA you need to modify the registry because Windows does not like it when the GPU runs for more than 5 sec.. But maybe you already did this.(See Bug 2.1.1 beta - Blue Screen of Death with CUDA at http://dit.ipg.pt/MBP/bugs.aspx).

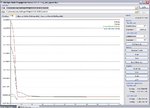
You are quite right, the data is not from Arry. I wanted more samples, so I collected data using the MT4 terminal on an MBT demo account. Here is the dated version of the data.
View attachment 77494

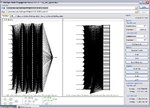
I made a mistake describing how I trained the net for the pictures. The net in the c file was trained with the test file active, because it must be to get the test RMS. But I tried several times without the test file and got roughly the same training RMS error. MBP does not optimize using the test data, so the only future leak is from the operator stopping training when the test rms error is minimized. I tried to ignore the test data for the images, so there should be small if any bias in the images. In the future, I will reserve a production set, and run the net on that set using the c code. That i s a bit of a pain, but I think as easy as using NS2 on a production set.

MBP is not perfect but I like it compared to alternatives.:D
fralo

Hi,

I think I found the problem. This discrepancy occurs only if i train using CUDA. For CPU training i've got similar results to yours. I informed Noel and he will release a new version of MBP soon.

I also tested 15-38-38-38-1 configuration with space network. See results seems to be worse RMS - 137 pips. For net without space net I've got 55 pips

Krzysztof
 

Attachments

  • 123epochs.jpg
    123epochs.jpg
    119.9 KB · Views: 465
  • 123space.JPG
    123space.JPG
    122.8 KB · Views: 465
  • 123space1.JPG
    123space1.JPG
    150.5 KB · Views: 552
Re: Another MBP net

Here's another net trained with MBP to predict the next bar high. I wanted to illustrate that one can get as good or better results using data that has been processed to avoid the nonstationarity problem, and that the net need not have so many inputs or weights. This net uses 1 hidden slab of 15 nodes with 4 inputs (4-15-1), so 75 weights, or about .003 weight/training sample. Curve fitting is almost impossible, and this will help generalization a lot. The inputs are calculated in the mq4 script attached in the zip file. They are:

• e is the normalized average of (C-L)/(H-L)
• d is the normalized average of (C-O)/(H-L)
• r is the normalized average of range (H-L)
• v is the normalized average of volume

The normalization is adjusted so that each feature has variance ~ 1, and mean 0, and the normalization adapts slowly.

The net predicts the difference of the next high from the current high. To get the high prediction one must add the current high. When all is said and done, this very simple net results in an mse error on the test set of about 16 pips. The 15-38-38-38-1 had an error of 40 pips using the same period of test data. It has .17 weight/training sample, so it too should generalize well, but curve fitting is possible.

Neither of these nets is going to be particularly useful by itself because the ATR is about 15-20 pips, but this net does illustrate that bigger is not always better, and careful input processing will be required to squeeze the best out of any neural net.

BTW it trained in 6 sec... no CUDA. Love that MBP:) Thanks again Krzys for the link.

View attachment 77500

16 pips ?? I opened your file and it shows 114 pips. I think MBP normalize inputs itself
between -1 1 - see FAQs.

Krzysztof
 

Attachments

  • pHigh.JPG
    pHigh.JPG
    120.6 KB · Views: 448
Perhaps possibility of improvement is to change the activation function for neurons on different layers.
I think Ward nets use this.

Krzysztof
 
Re: Another MBP net

16 pips ?? I opened your file and it shows 114 pips. I think MBP normalize inputs itself
between -1 1 - see FAQs.

Krzysztof
The MBP does show .0114, but this is not in pips.

MBP does normalize the input and output to -1,1. So that means that we need to denormalize the mse measure. The mse reported on the MBP display is the mse of the normalized output compared to the normalized desired output. I suppose that one could look at the c-coded net and figure out how to relate the normalized mse to the mse of the denormalized output, but that might be error prone.

Instead, I used the c-code for the net (pHigth.c) to process the inputs and generate an output that is now de-normalized..i.e. it is an output that can be compared to the high in pips. That output is provided in the zip file as pHighout.txt. (you can replicate it by running pHigh.exe). It's columns are predicted delta high (pdH), True delta high( True pdH), difference between col 1 and 2 (error), predicted High (pHigh) and True High(High). At the bottom of the error column is the standard deviation of that column. It is 0.0017, or 17 pips. Did I say 16? sorry, I don't know how that mistake was made, but I think it came from a different training of the same net. Variations of a pip or so seem reasonable.

While we're at it let's talk about the predictability of the next bar high using this approach. First consider some simpler methods to predict the next bar high (using the same data set):
1. Set the predicted high to the current high. mse = 21 pips
2. Use a 2 point linear predictor. mse = 29 pips
3. Increase the network complexity (4-15-15-1, 4-38-38-38-1, Multiple feed forward networks, space network). mse=17 pips+_
That convinces me that there is a lot of variation in the next bar that is unpredictable using information in the current bar. Probably we cannot get to a useful value of mse (about = spread) simply using the price series we are trying to predict. So we should look at using other price series. That's my next project, but I think I need at least 10000 samples for the results to be meaningful. Until I can get another data source, I'm going to be restricted to the Fx pairs on MBT. (I have found no free data source for things like e-mini's, oil, gold, etc that will provide more than ~2000 samples at any TF).

BTW, did you resolve your MBT -CUDA problem? I have been thinking of getting another display and installing CUDA, but not if I will have problems such as you described.
fralo/MadCow
 
Perhaps possibility of improvement is to change the activation function for neurons on different layers.
I think Ward nets use this.

Krzysztof
MBP allows you to use Sigmoid, Tanh, Gaussian, and Linear activation functions. I tried them all with 4-15-1. The mse varies slightly, but only in the fourth decimal (.0116 vs .0114). It may be that other architectures such as recurrent or Ward will give some improvement, but I doubt that it will be much. Maybe someone with experience with another NN program can comment?

Nope, I think that we must use better inputs, or else try to predict some other output. In the past I have tried to predict a low-lag filter (in that case, Hull). I got wonderful results wrt mse. But all the errors came when the filter was changing direction. That is just when you need accuracy, since those points are entries. So, another precaution... mse is not the whole story.
 
Re: Another MBP net

The MBP does show .0114, but this is not in pips.

MBP does normalize the input and output to -1,1. So that means that we need to denormalize the mse measure. The mse reported on the MBP display is the mse of the normalized output compared to the normalized desired output. I suppose that one could look at the c-coded net and figure out how to relate the normalized mse to the mse of the denormalized output, but that might be error prone.

Instead, I used the c-code for the net (pHigth.c) to process the inputs and generate an output that is now de-normalized..i.e. it is an output that can be compared to the high in pips. That output is provided in the zip file as pHighout.txt. (you can replicate it by running pHigh.exe). It's columns are predicted delta high (pdH), True delta high( True pdH), difference between col 1 and 2 (error), predicted High (pHigh) and True High(High). At the bottom of the error column is the standard deviation of that column. It is 0.0017, or 17 pips. Did I say 16? sorry, I don't know how that mistake was made, but I think it came from a different training of the same net. Variations of a pip or so seem reasonable.

While we're at it let's talk about the predictability of the next bar high using this approach. First consider some simpler methods to predict the next bar high (using the same data set):
1. Set the predicted high to the current high. mse = 21 pips
2. Use a 2 point linear predictor. mse = 29 pips
3. Increase the network complexity (4-15-15-1, 4-38-38-38-1, Multiple feed forward networks, space network). mse=17 pips+_
That convinces me that there is a lot of variation in the next bar that is unpredictable using information in the current bar. Probably we cannot get to a useful value of mse (about = spread) simply using the price series we are trying to predict. So we should look at using other price series. That's my next project, but I think I need at least 10000 samples for the results to be meaningful. Until I can get another data source, I'm going to be restricted to the Fx pairs on MBT. (I have found no free data source for things like e-mini's, oil, gold, etc that will provide more than ~2000 samples at any TF).

BTW, did you resolve your MBT -CUDA problem? I have been thinking of getting another display and installing CUDA, but not if I will have problems such as you described.
fralo/MadCow

OK, I didn't think that we must denormalize, but yes it must be done.

Noel made another net 15-30-30-1 with space net and went down with MSE to 15 pips
on our data with CUDA and 150 000 epochs. I attach his net.

Regarding problem. I think you can buy NVIDA card. MBP work for him without problem
with CUDA, he says that small bug exist with step size for CUDA and he will fix it in next release. This can be a reason that for small number of epochs under CUDA RSE dont converge fast enough like under CPU.

Krzysztof
 

Attachments

  • mbp30-10.zip
    27.2 KB · Views: 335
Regarding extra data. I think Arry mentioned in one of his post where he opened account to have all this info.

Should we maybe predict lower TFs ?? like 1m or 5m ?? For sure its easier because short tem market is more stabile, within 10-20 min not so much can happen but who know what can happen in 1 day. And it will be easy to get more samples for test.

Krzysztof
 
Re: Another MBP net

OK, I didn't think that we must denormalize, but yes it must be done.

Noel made another net 15-30-30-1 with space net and went down with MSE to 15 pips
on our data with CUDA and 150 000 epochs. I attach his net.

Regarding problem. I think you can buy NVIDA card. MBP work for him without problem
with CUDA, he says that small bug exist with step size for CUDA and he will fix it in next release. This can be a reason that for small number of epochs under CUDA RSE dont converge fast enough like under CPU.

Krzysztof

Do I have to uninstall old version of MBP to install new, or can I install on top?
 
Re: Another MBP net

uninstall
That net is really encouraging.:clap:

I looked at the denormalized mse from Noel's net. I plotted the std deviation averaged over previous 500 samples. It is actually closer to 11 pips for most of the samples, but increases to 27 pips near the end. Image is attached. It shows the difficulty using prices without first differencing, I think. Anyways, there is a definite change in mse late in the samples. Probably because the price rises at the end to values that do not occur in the training sample. I bet if we do something to reduce the non-stationarity, we can get to 11 pips. But I'm not sure that's enough, so I will still look at another set of data.
mse.jpg

How long did it take to train? I'm on my way to get an Nvidia card.
fralo/MadCow
 
Re: Another MBP net

That net is really encouraging.:clap:

I looked at the denormalized mse from Noel's net. I plotted the std deviation averaged over previous 500 samples. It is actually closer to 11 pips for most of the samples, but increases to 27 pips near the end. Image is attached. It shows the difficulty using prices without first differencing, I think. Anyways, there is a definite change in mse late in the samples. Probably because the price rises at the end to values that do not occur in the training sample. I bet if we do something to reduce the non-stationarity, we can get to 11 pips. But I'm not sure that's enough, so I will still look at another set of data.
View attachment 77594

How long did it take to train? I'm on my way to get an Nvidia card.
fralo/MadCow

I just managed to stabilize CUDA on my PC and it works also fine.

CUDA is very fast and calculation is quite simple. For example my GTS 250 has 128 1.5Ghz cores so its max execution speed is like 192GHz. One CPU core on which runs MBP is like 4 GHz so factor is 48 times faster than PC. This is in case when all kernels would be loaded 100%. Most likely they are not.

The best one is GTX 285 or 280 with 240 cores. There is also GTX 295 with 2 GPUs but MBP only uses one. Than there are Tesla's but they are much more expensive.

Krzysztof
 
Regarding extra data. I think Arry mentioned in one of his post where he opened account to have all this info.

Should we maybe predict lower TFs ?? like 1m or 5m ?? For sure its easier because short tem market is more stabile, within 10-20 min not so much can happen but who know what can happen in 1 day. And it will be easy to get more samples for test.

Krzysztof
I have opened demo accounts at both brokers Arry mentioned..UWC and ODL. I cannot download more than 2048 samples at any TF on any non-FX symbol (dji,SP500, etc.). I doubt that that is enough data to do good job training and testing.

I think TF should be less than 1 day, too. But we can get daily data from other sources (Yahoo?) for many years, but not any TF less than 1 day.

Using TF like 1 min, 5 min is tempting. But the spread may swamp any edge we get from a noisy prediction. The price is probably easier to predict, but that's because it doesn't change much, and we cannot profit from small changes without paying the spread. Probably there is an optimum TF from the standpoint of error and spread, but I don't know how to find it until we have a system. Maybe develop nets at H1, then go both ways to look for the best? Also, maybe the network developed at one TF will work at another? Arry thinks so.
 
Re: sample size - data minig bias error

Hi Guys,
Krysz.. I think number of rules is also proportional to the number of weights in the net, because more rules are possible with more weights. When number of weights > number of samples, lookout! The suggested limit on number of weights in NeuroSolutions Trader is 1/10 the number of samples in the training set. I have seen this elsewhere in the neural net literature, but cannot remember where (hence MadCow memory).

by rule i meant this

page 394 EBTA

RULES: TRANSFORMING DATA SERIES
INTO MARKET POSITIONS

A rule is an input/output process. That is to say, it transforms input(s),
consisting of one or more time series, into an output, a new time series
consisting of + l's and -l's that indicate long and short positions in the
market being traded (i.e., S&P 500). This transformation is defined by the
one or more mathematical, 7 logical, s or time series 9 operators that are ap-
plied to the input time series. In other words, a rule is defined by a set of
operations. See Figure 8.1.


So rule simple can be one trained net. which generate Buy/Sell signals. But in order to assess predictive power of the rules we need more than one. Than it would be possible to use MonteCarlo or bootstrap method to check if it will really predicts the future...

My idea than one epoch = 1 net = 1 rule was wrong due to data snooping bias. On every epoch new net is created from old net which is not statistically independent and contains already information from data mining.

number of weights and sample size its degree of fredom assesment to avoid overfitting and i think its not enough to say that if NN is not overfitted than it has significiant predictive power

So any idea how to proceed with assessing and quantifying of predictive power of trained NN ?? Maybe someone from silent readers has some info or idea ??

Krzysztof
 
Re: sample size - data minig bias error

by rule i meant this

page 394 EBTA

RULES: TRANSFORMING DATA SERIES
INTO MARKET POSITIONS

A rule is an input/output process. That is to say, it transforms input(s),
consisting of one or more time series, into an output, a new time series
consisting of + l's and -l's that indicate long and short positions in the
market being traded (i.e., S&P 500). This transformation is defined by the
one or more mathematical, 7 logical, s or time series 9 operators that are ap-
plied to the input time series. In other words, a rule is defined by a set of
operations. See Figure 8.1.


So rule simple can be one trained net. which generate Buy/Sell signals. But in order to assess predictive power of the rules we need more than one. Than it would be possible to use MonteCarlo or bootstrap method to check if it will really predicts the future...

My idea than one epoch = 1 net = 1 rule was wrong due to data snooping bias. On every epoch new net is created from old net which is not statistically independent and contains already information from data mining.

number of weights and sample size its degree of fredom assesment to avoid overfitting and i think its not enough to say that if NN is not overfitted than it has significiant predictive power

So any idea how to proceed with assessing and quantifying of predictive power of trained NN ?? Maybe someone from silent readers has some info or idea ??

Krzysztof

You are quite right. I was thinking of degrees of freedom. Maybe ngawang would have an opinion?
 
Hi Arry,

I hope your travel home was OK.

As you see we made some tests using MBP and obtained minimal RMS like 11 pips on 150 000 epochs. Can you try your nets on data from post #98 to see what minimal error you can get ??

Than we can initially judge what methodology is better.

Krzysztof
 
Hi Krzys,

Thanks you, my travel is OK..but a little bit jet lag (I could not sleep on the right time..)

I downloaded DatedData from post #98, it consist of:
Time Volume ATR H L H1 L1 H2 L2 H3 L3 H4 L4 pH pL

Please advice what kind of data (H1 time frame), which are inputs and output that you are required on your net. It consist as well 5312 rows of data including the labels (only first row consist #VALUE that should be removed). My understanding H1 is lead 1H from H, H2 is lead 2H from H, etc, but what is pH and pL? How many rows for Training, Test and Production? Sorry I am totally lost...

I need those information prior training the net and giving the result.

Thank you

Arry
 
Last edited:
in post 93 there is a correct data in file 15-38-38. There are two files train and test so just use them how they are. Inputs are all columns except last one which is output. Datedate. zip seems to be different.

Krzysztof
 
Hi Krzys,

Please find here attached Training and Test result for NS2, the detail is explained on the pdf file.

I made my own trick to combine your train and test data as a file and adjust the training and test range as per original configuration. Using 5 layers backpropagation network, the result: minimum average error: 0.0000302 (0.3 pip) on 19997 train pattern and 0.0000624 (0.6 pip) on 4998 test pattern resulted within 8 min 40 s.

The second file using NSpredictor only for Train pattern: NN method resulting MSE 0.000001 and R squared 0.999942, and using GA resulting MSE 0.000005 and R squared 0.999743. The training only within 16 second for NN and less than 3 minute for GA. The NN stop by itself and GA I stop manually (require more times). I need to find the way how to indicate the result with the test pattern.

Use the same password as the last file password, any other who requested please PM me.

Regards,
Arry
 

Attachments

  • Using NS2 for Train and Test.pdf
    365.3 KB · Views: 644
  • Train using NS predictor.pdf
    430.2 KB · Views: 545
Hi Krzys,

Please find here attached Training and Test result for NS2, the detail is explained on the pdf file.

I made my own trick to combine your train and test data as a file and adjust the training and test range as per original configuration. Using 5 layers backpropagation network, the result: minimum average error: 0.0000302 (0.3 pip) on 19997 train pattern and 0.0000624 (0.6 pip) on 4998 test pattern resulted within 8 min 40 s.

The second file using NSpredictor only for Train pattern: NN method resulting MSE 0.000001 and R squared 0.999942, and using GA resulting MSE 0.000005 and R squared 0.999743. The training only within 16 second for NN and less than 3 minute for GA. The NN stop by itself and GA I stop manually (require more times). I need to find the way how to indicate the result with the test pattern.

Use the same password as the last file password, any other who requested please PM me.

Regards,
Arry
Hi Arry, Welcome back. The Fx market waited for your return.:)

Does NS2 allow to export the output of the network? If so, can you post the output for the NS2 net?


fralo/MadCow
 
Top