Here is the implementation of Trained net on NS predictor.
So far I found 2 methods:
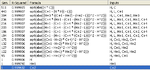
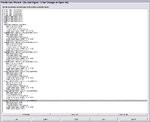
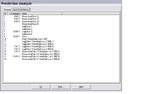
1. Call the data into excel and firing the net.
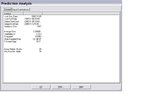
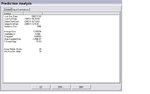
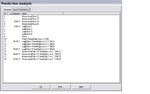
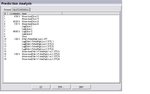
2. Open the test data and use the trained net to fire up. I got R-squared 0.995045, MSE 0.000004, %sign 100% with 4998 test pattern. Compare with training pattern R-squared 0.999942, MSE 0.000001, %sign 100% with 199997 train patterns.
See attached pdf file for the actual report.
Fralo, have you make any MT4 indicator to show predicted value on the chart? or create an EA to generate trading signal?
Best regards,
Arry
So far I found 2 methods:
1. Call the data into excel and firing the net.
2. Open the test data and use the trained net to fire up. I got R-squared 0.995045, MSE 0.000004, %sign 100% with 4998 test pattern. Compare with training pattern R-squared 0.999942, MSE 0.000001, %sign 100% with 199997 train patterns.
See attached pdf file for the actual report.
Fralo, have you make any MT4 indicator to show predicted value on the chart? or create an EA to generate trading signal?
Best regards,
Arry