Breakout Trading using Time and Sales

Re: HRBN Trade

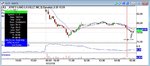
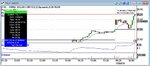
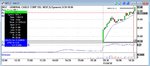
Similar setup to the one discussed on October 22. I spotted HRBN on a scanner and within seconds, saw strong bid pressure on level 2. Decided to initiate a long position (albeit, slightly late) and got filled at 20.63. Given how far away the low of the previous candle was, I was not prepared to have such a large stop and therefore, was using level 2 actively in managing the trade.

As soon as it hit the 90-cent level, there was a lot of selling pressure and I decided to get out. A lot of sell orders came through and the 90-cent bids got wiped out, leaving me with an exit at 20.87. See attached screenshot of the broker window for more details.

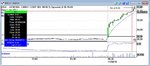
Anyone using a trailing stop like the ones I discussed previously would still have been profitable, though slightly less.

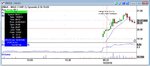
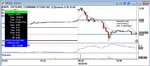
Entry on the crosshairs; exit detailed on chart.

Quite a choppy morning overall today with small gains and small losses. This trade was the second biggest gainer of the day. The idea is to keep your losses as small as possible and the profitable trades will take care of themselves.

Amit

What a pleasure to read your posts.A gem amongst the rising pile of dross on this site:)
 
Similar reversal setup just happened on LXK, with very strong level 2 momentum. I decided to not take it because the ATR was far too large and the spread far too wide. Would have been a beautiful trade though. Oh well! Still a profitable day :)
 
wow, i must be getting better, i was into this at a similar time to you! That in my book is progress!

The fact that i can relate to what you are writing is considerably more valuable than some of the threads from 2005 i have been reading lately.

I caught a bit of HRBN on the way down $21.47 to $21.00 roughly. Just a paper trade though. :-(

To me your move seems very brave considering that 4 bars previous to your entry, a very similar volume/chart pattern resulted in a sharp down move against the retracement. Must have been something in the L2 T&S to make you go countertrend?

I wasn't watching it after the downtrend seemed to be over and haven't mastered the Mr. C bounce trade yet. Interesting about your volume observations, a well documented occurence in many a trading book but also often forgotten it seems.

Keep up the good work Amit. Glad your keeping the thread going.

Coop

Good job on the HRBN short - I found it after it started retracing so missed tbe move. As for the braveness of my counter-trend trade, I only take them if, and only if, the following occur:

1) The ATR is reasonably small; and
2) the stock is readable on level 2 / time and sales; and
3) there is enough momentum on level 2.

If any of the three conditions above are not satisfied, I simply do not trade it. Sometimes this results in me missing out on big moves and other times, I am saved from "losing my shirt". But, on average, I am able to maintain consistency through this discipline.

Glad you're enjoying the thread,

Amit
 
Similar reversal setup just happened on LXK, with very strong level 2 momentum. I decided to not take it because the ATR was far too large and the spread far too wide. Would have been a beautiful trade though. Oh well! Still a profitable day :)

Reading this made me smile Amit because I remember when I day traded stocks throughout 2008 and, like you, I steered clear of these for much the same reasons as you state here. That was until Naz showed up singing the virtues of POT. At the time (early summer 2008) I think it was around the $140 mark and could easily move 5-6 dollars a day. Sometimes more. Using ATR the same way as you and Richard use it, I was able to place a wide stop and traded very small size, often less than 50 shares. I loved it. I absolutely loved it. At the end of the year, IB (who was my broker at the time) produced all manner of trading stat's. Guess which stock was my most profitable - and by a very wide margin? Yep, it was POT. When the crash came in the autumn that year, POT's price halved, along with the spread (often 15-20 cents). And I stopped making money on it. Gutted I was, absolutely gutted! Anyway Amit, you're waaaaaaaaaaaay more skilled and experienced at trading stocks than I ever was so, far be it for me to tell you what to do, but you might like to have a go paper trading the big volatile beasts with wide spreads and huge ATRs. You never know, you might just be very pleasantly surprised!
;)
Tim.
PS. Please note that my comments do not apply to inexperienced traders who don't have a solid understanding of the dangers of wide spreads and huge volatility in high priced stocks!

Hi Tim,

It's great to hear about your stock trading days - surely, you must try equity trading again soon!

As for "the big volatile beasts with wide spreads and huge ATRs", I used to trade them (without reducing my position size) when I started out trading. Occasionally, I'd get big moves on them, but sometimes, I'd also get burnt - often giving up an entire days gain. Also, I must admit that I never once felt comfortable in those type of stocks and they were definitely the wrong way to start learning to read level 2.

So I decided to let them go and have noticed a drastic improvement in my consistency ever since. Sure, I am not getting many big moves, but by taking several modest gains on several trades (while also keeping losing trading small), I am able to maintain consistency, which is, at the end of the day, what every trader seeks. If it means I have to give up going for the big gains, it`s a price I am willing to pay. One thing is certain - if you`re starting out learning to read level 2, the worst thing you can do is try to read expensive, high-ATR stocks. They are simply too fast and have too wide of a spread. But like with all things in life, as you gain more experience and improve, you should set yourself to the challenge of slowly trading more volatile stocks.

I do, sometimes, take trades in stocks with ATRs that are outside my comfort zone, but I am extremely fussy about level 2 in those. If I feel slightly uncomfortable prior to taking a trade, I will simply let it go, knowing full-well that there are plenty of other opportunities.

I might be picky about my trading, but like I said before, this sort of discipline has drastically improved my consistency.

Amit
 
Different trade

A different sort of setup occured on a stock I had spotted off a scanner today - JLL. By looking at the chart, the stock had plunged significantly in the early hours of the morning. It then retraced and was in the process of forming an inverted head and shoulders pattern.

As per any head-and-shoulders pattern, the entry is initiated upon the break of the neckline. However, in this case, there was little momentum on level 2. As the pattern failed and the stock started retracing, there was a good chance the stock would continue plummeting.

Watching the level 2 screen, there was significant selling pressure growing and I shorted JLL at $79.00. As it started to plummet, I had kept in mind a worst-case stop loss at the opposite end of the previous candle, as proposed by Mr. Charts.

Given the importance of whole numbers, I could see growing bid pressure at the $78 area and closed my position at 77.89, locking in a gain of $1.10 per share.

Entry on the cross-hairs on the chart; exit as detailed on chart. Also see broker screenshot for precise entry/exit information, including time of trades taken.

The key in this trade was the failed inverted head-and-shoulders pattern, along with growing selling pressure on level 2.

Amit
 

Attachments

  • JLL_short.jpg
    JLL_short.jpg
    144.1 KB · Views: 228
  • JLL_broker.jpg
    JLL_broker.jpg
    15.9 KB · Views: 152
So far, three trades today (two profitable, one loser), including a trade on IMAX early morning as per the setup on Mr. Charts' thread of rising candles. Got +25 cents per share out of it in a matter of minutes.

One loser as well which was -5 cents per share.

I will post charts of both of these trades later on today.

Amit
 
First trade of the day - IMAX, which I had on my watch list before the market opened.

Started trending up with each candle making a higher high and higher low - a clear uptrend. Entered long as it broke the important $20 area, getting filled at 20.07. Stock continued to tick higher steadily and was readable on level 2.

At a certain point, it became erratic and un-readable, so I felt like I lost my control in the trade and decided to exit. That's exactly what happened after - it started whipsawing around.

Entry on crosshairs; exit as detailed on chart.

Entry: 20.07
Exit: 20.33
Profit: +26 cents per share
Length of trade: 4 minutes

See broker screenshot for exact prices and times.

One thing to note here is that I actually hit the $20.00 offers when I saw momentum on level 2, but ended up getting filled at 20.07 - in a fast market, slippage is common.

I was also using a worst-case stop of the opposite end of the previous candle. Even though my entry candle did push through the previous candles low, this was a series of odd-lot trades. Any physical stops in the market would have been executed. But since I was using a mental stop-loss, I was able to identify all the trades on the time and sales screen and didn't exit.
 

Attachments

  • IMAX_breakout.jpg
    IMAX_breakout.jpg
    130.1 KB · Views: 235
  • IMAX_broker.jpg
    IMAX_broker.jpg
    13.6 KB · Views: 136
Here's another trade, this time a losing trade.

Stock was trending down, retraced, and then it seemed to continue its down trend. I saw some bearish market maker activity on level 2 and decided to initiate a short position at the 50-cent level. Within a few seconds, that activity changed and I immediately closed out my trade.

Short: 8.50
Covered: 8.55
Loss: -5 cents per share
Length of trade: 41 seconds

If the trade isn't doing what it should be doing, then why wait for a stop to be hit? It's best to just get out and keep your losses as small as possible.

Amit
 

Attachments

  • ENTR_earlyentry.jpg
    ENTR_earlyentry.jpg
    132.4 KB · Views: 204
  • ENTR_failed.jpg
    ENTR_failed.jpg
    11 KB · Views: 109
Two breakout trades so far within the first 10 mins of the market.

CQB: +17 cents per share
STEC: +0 cents per share (scratch trade)
 
SLW: +2 cents per share

Wasn't doing what it should be doing, so just got out. Good decision as my stop would have been triggered and it would have been a loss.

With momentum trading, if the trade doesn't do what it should be doing, there's no point in sticking with it. There's a high chance your stop will be hit more often than not.
 
Just scalped 35 cents per share out of BGC breakout based on Mr. Charts' setup. I will post a chart of this trade a little later on.

This was the first trade of the day. A lot of other stocks were doing well on my watch list, but their ATRs were too high, so I decided to wait until I found something that I was comfortable trading. It was worth the wait :)
 
Just got another 52 cents per share out of BGC breakout. Momentum was brilliant on level 2.

Took some more trades prior to this one, with a few small losses.

Out of BGC too early. But with the spike in volume at the break of the whole number, I was concerned it could have been a volume blow-off.
 
First trade of the day - BGC, which I found off a scanner. Rising candles with higher highs and higher lows indicating the presence of buyers.

Took a long on the break of the retracement and rode it up till momentum died.

Entry: 30.97
Exit: 31.32
Profit: +35 cents per share
Length of trade: 2 minutes

ATR was slightly higher than I like it to be, but I could read on the level 2 screen, momentum was very good and the spread was small so I felt I had complete control in this trade.

Entry on the crosshairs; exit as detailed on chart. See broker screenshot for precise entry/exit information and time of trades taken.
 

Attachments

  • BGC_trade1broker.jpg
    BGC_trade1broker.jpg
    43 KB · Views: 141
  • BGC_trade1chart.jpg
    BGC_trade1chart.jpg
    126.5 KB · Views: 229
Here's a losing trade: TSL. This was also trending up and I decided to go long when level 2 confirmed an entry. It then changed its behavior and I got out for a small loss.

Entry: 28.26
Exit: 28.22
Profit: -4 cents per share
Length of trade: 2 minutes

Entry on the crosshairs; exit as detailed on chart. See broker screen shot for precise entry/exit information, including time of trades taken.

If it doesn't do what it should be doing, then get out. There are plenty of other opportunities. As long as losses are kept small, you can come out on the winning side.
 

Attachments

  • TSL_tradechart.jpg
    TSL_tradechart.jpg
    138.4 KB · Views: 198
  • TSL_broker.jpg
    TSL_broker.jpg
    11.1 KB · Views: 146
And finally, another breakout trade on BGC. This time, on the 3-minute chart. Notice how clean the chart is - by immediately glancing at it, the uptrend obvious. The cleaner the chart, the higher the probability the trend is likely to continue. If a chart is filled with doji's and hammers, it increases the likelihood of being chopped out for small losses. Stick to clean, clear charts.

Momentum on the breakout was same as the the first trade on BGC.

Entry: 31.80
Exit: 32.32
Profit: +52 cents per share
Length of trade: 3 minutes

Entry on the crosshairs; exit as detailed on chart and broker screenshot.

Amit
 

Attachments

  • BGC_trade2chart.jpg
    BGC_trade2chart.jpg
    139.9 KB · Views: 180
  • BGC_trade2broker.jpg
    BGC_trade2broker.jpg
    10.8 KB · Views: 159
Top