Breakout Trading using Time and Sales

Hi D70,

None of my trades yesterday were breakouts, but rather, based on other setups that I use. Uploading a screenshot of these setups would not be fair to those who have paid for that information. However, when I do take my next breakout trade, I will post an image of it here.

Perhaps I should change the title of this thread to something more than just breakouts...not exactly sure how to do so though!

Amit
 
How come you only took 40 cents? Did you get the entry a little late?
 
How come you only took 40 cents? Did you get the entry a little late?

Entry was perfectly fine, but the stock reached an area which I thought would give it trouble (several layers of resistance), so as soon as I saw some selling pressure building, I decided to exit, knowing full well that a 40 cent move in a summer's afternoon is quite large.

I was wrong about the exit, as it continued to go up another 20 cents. Nevertheless, I am glad I was able to get a nice bite out of it.

ok, apologies, i thought your trade was a short at the start of the day. A buy on that stock looked pretty hard apart from off the big 5.0. !

Well played.
 
ok, apologies, i thought your trade was a short at the start of the day. A buy on that stock looked pretty hard apart from off the big 5.0. !

Well played.

No need to apologize! :)

I actually found that stock off a scanner around mid-day, so I missed that nice short early in the morning.

Best luck trading today!
 
Perhaps I should change the title of this thread to something more than just breakouts...not exactly sure how to do so though!
Hi Amit,
If you want to do this, just PM the revised title to me and I'll change it for you.
Tim.
 
Hi Amit,
If you want to do this, just PM the revised title to me and I'll change it for you.
Tim.

Thanks Tim! I'll think of an appropriate title soon and will let you know. If there are any suggestions out there, I am open to hearing them.

Amit
 
An example of how a simple swing-trade setup can turn into a scalp-like trade

An interesting setup occured on CSTR today. The stock had been falling all day, so I was looking for a possible reversal trade.

It finally showed some signs of reversing, but I didn't take it on the initial green candle with a large bottom wick. Instead, I decided to wait and see if I could get a nice swing out of it.

It started to head back down (possibly because the overall market was falling at that time), paused, then started to show signs of continuing a move upward. From the chart, this formation was a small double-bottom.

I then drew a trend line which I would use a worst-case stop loss (i.e., if price penetrated that trend line, then it would mean that the stock wasn't doing what I thought it would do and I would close out my position).

Long entry taken on the horizontal blue line at 40.955. I drew a red horizontal line at around 41.18 as a possible exit. This area was the entry price + ATR.

Price continued to tick up slowly until some strong selling pressure on level 2 told me to get out. Furthermore, the Nasdaq futures also started to fall, so I closed my position at 41.03, yielding 7.5 cents per share.

In this choppy environment, it's important to be flexible and know when to close out a position even if an exit signal does not come. At least you're able to walk away with some sort of profit. Had I stayed in this trade, I would have been stopped out and lost 6 cents per share.

Amit
 

Attachments

  • CSTR.jpg
    CSTR.jpg
    140.1 KB · Views: 235
I guess I was wrong about the markets picking up steam. Today is a very choppy environment...picking up small scalps here and there.
 
It's "quad-witching" day today, meaning all options and futures are expiring and this will likely present some additional (much needed) volatility in the markets. Furthermore, upside surprise results by ORCL and RIMM have really got the markets going. Got the following stocks on the watch list:

ORCL*, RIMM, MEE, ARNA*, ALKS, TXN, ABX, MT, ALKS, SAP, AIXG, and CRXL.

Stocks marked with a * will either have too much volume to properly read on level 2/t&s or will be too low priced too trade. CRXL usually has too low average daily volume, but it's traded over 510,000 shares pre-market, so it could be different today.

Amit
 
Early breakout trade

Here's a trade from this morning - a quick 18 cent/share scalp. Stock was trending up nicely. I took an early entry based on level 2 and was thinking I could get at least the ATR in cents out of it, but it suddenly became erratic and unreadable as it pushed to new highs. Because I couldn't read it any longer, I simply decided to exit.

Entry on the crosshairs at 45.97.
Exit at 46.15.
Profit: +18 cents/share.
Length of trade: 3 minutes.

I, most often, avoid trading such high ATR stocks, but momentum was brilliant on level 2 and I decided to go ahead with it, knowing that if it reversed, I would quickly get out.
 

Attachments

  • PLCE_breakout.jpg
    PLCE_breakout.jpg
    127.8 KB · Views: 209
And here's what happened to PLCE after...Note this is a 3-minute chart. Price never bothered to continue higher.

Everyone wants those big moves, but I am realizing that focusing on just taking what the market gives, instead of anticipating a specific amount of profit, is what makes consistency.
 

Attachments

  • PLCE_after.jpg
    PLCE_after.jpg
    137.6 KB · Views: 218
Good stuff, Amit :)
When the evidence in front of your eyes says get out, you get out and that includes uncertainty :)
If you'd stayed in longer you'd have lost your profits and ended up in loss - your exit candle proved to be the high of the day so far. Great L2 T&S reading and great executions ;)
Richard

Thanks, Richard! I am finding that, like learning how to read price action, learning to know when to exit is also a skill that requires (a lot of) practice. :)
 
And, finally, here's one to show I don't get it right all the time. BAX was also trending up nicely, though I was slightly concerned as to the length of the retracement! Nonetheless, level 2 started picking up a bit of steam and I decided to take an early entry, getting filled at 51.36. It continued up for a couple of cents before I saw a sudden rush of selling pressure building up on level 2 and time and sales.

From the chart, there was clearly resistance around the pivot, so I kept that in mind prior to entry, knowing full-well that it could fail around there and if it started to look weak, I would immediately get out. As soon as it started to look weak, I exited on the 51.40 bid, but got filled at 51.37 - enough to just cover the commissions and breakeven.

ATR on this one was slightly higher than I like it to be, but I could read the order flow as it was smooth, so I felt comfortable and in control whilst in the trade. Also, prior to entry, I had a strategy mapped out in my mind - knowing my exit if it were to fail.
 

Attachments

  • BAX_failedbreakout.png
    BAX_failedbreakout.png
    92.2 KB · Views: 231
Mr. Charts made an interesting statement in his thread regarding the union of a scalpers entry and a swing-trade exit. I'm quite fond of that type of setup and find it works best during the after/late-afternoon session of the U.S. market, when things calm down a bit.

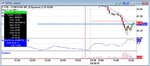
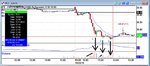
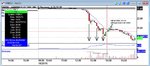
Here's an example from today's trading. I took a look at FE after it plunged down on heavy volume about 4.5%. At this point, I was slightly skeptical on shorting it, reasoning that all the large sell orders have probably already gone through and there could be little follow through to more downside. So, in my mind, I was anticipating a reversal trade.

As per the chart, everytime the stock broke to new lows, it did so on lower and lower volume. This told me that there were less sellers left and I was looking to go long as soon as level 2 told me to do so.

As soon strong bid pressure towards the 50-cent level, I took an entry at 37.50, whilst keeping a worst-case mental stop towards the low of the day. Since this was a swing trade, I was paying less attention to level 2 for an exit signal and more attention to the chart and the overall market direction.

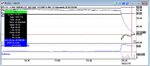
For several minutes, this stock was chopping around but there was no real reason to get out. I could see on level 2 that as the price ticked higher, sellers were disappearing. Approximately 40 minutes later, I saw strong selling pressure on level 2 and decided to close my position, locking in a gain of 21 cents per share.

Entry: 31.50
Exit: 31.71
Profit: +21 cents per share
Length of trade: 40 minutes

For those interested in this sort of setup, look for the following:

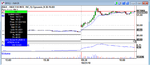
1) Stocks that have collapsed significantly in a short amount of time. I look for decreases of more than 5%, but prefer something in the range 8%-9%.

2) Decreasing volume on corresponding breakouts indicating sellers are slowly diminishing.

3) Entry around important areas such as whole numbers, 50-cent levels, EMA(10) penetrations, etc...If none of those are nearby, then it is also possible to go long on the break of the high of the previous candle that showed lower volume.

4) Exits can initially be set at the low of the day and once the trade turns profitable, exits can be trailed in various ways (low of the previous candle, penetration of the EMA(10), or level 2 activity).

It's best to take these sort of trades if the market is going in the direction of the trade as it increases the probability of a successful trade.

Amit
 

Attachments

  • FE_reversalswing.jpg
    FE_reversalswing.jpg
    149.6 KB · Views: 259
  • FE_broker.jpg
    FE_broker.jpg
    13 KB · Views: 172
A similar trade setup on HRBN as discussed in my previous post just gave me 24 cents per share profit. I will post a chart of the trade later on. For those interested, check out the 5-minute chart with the corresponding volume bars (decreasing with each breakout).

Entry: 20.63
Exit: 20.87
Profit: +24 cents per share
Length of trade: 8 minutes
 
HRBN Trade

Similar setup to the one discussed on October 22. I spotted HRBN on a scanner and within seconds, saw strong bid pressure on level 2. Decided to initiate a long position (albeit, slightly late) and got filled at 20.63. Given how far away the low of the previous candle was, I was not prepared to have such a large stop and therefore, was using level 2 actively in managing the trade.

As soon as it hit the 90-cent level, there was a lot of selling pressure and I decided to get out. A lot of sell orders came through and the 90-cent bids got wiped out, leaving me with an exit at 20.87. See attached screenshot of the broker window for more details.

Anyone using a trailing stop like the ones I discussed previously would still have been profitable, though slightly less.

Entry on the crosshairs; exit detailed on chart.

Quite a choppy morning overall today with small gains and small losses. This trade was the second biggest gainer of the day. The idea is to keep your losses as small as possible and the profitable trades will take care of themselves.

Amit
 

Attachments

  • HRBN_reversalswing.jpg
    HRBN_reversalswing.jpg
    145.9 KB · Views: 237
  • HRBN_broker.jpg
    HRBN_broker.jpg
    14.7 KB · Views: 137
wow, i must be getting better, i was into this at a similar time to you! That in my book is progress!

The fact that i can relate to what you are writing is considerably more valuable than some of the threads from 2005 i have been reading lately.

I caught a bit of HRBN on the way down $21.47 to $21.00 roughly. Just a paper trade though. :-(

To me your move seems very brave considering that 4 bars previous to your entry, a very similar volume/chart pattern resulted in a sharp down move against the retracement. Must have been something in the L2 T&S to make you go countertrend?

I wasn't watching it after the downtrend seemed to be over and haven't mastered the Mr. C bounce trade yet. Interesting about your volume observations, a well documented occurence in many a trading book but also often forgotten it seems.

Keep up the good work Amit. Glad your keeping the thread going.

Coop
 
Top