Darth,
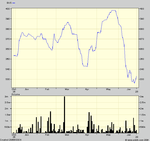
BVS is not a chart that I follow closely, but having read your post I decided to have a look.I don't know what your normal trading time frame is but I'm a bit cautious of this one slightly longer term, very short term may be a run up to resistance at 336 then 349.Looks to me as if some inportant support levels have been breached, the 349 level was a support level going back to 29/10/99 and 336 was a short term falling support level from 03/01/01.I know that recent price trend has been for higher highs but this has been followed by lower lows, finally leading to a low below support.
Current price patern, double bottom does point to a price rise short term, but this patern is from the second bottom being lower than the first normally this could point to limited upside and struggle to pass strong resistance levels.
Good luck if you do play this one,I'll be waiting for a break back into that longterm upward channel or a base patern with a higher low before being tempted in.
Regards
Sparky.