You are using an out of date browser. It may not display this or other websites correctly.
You should upgrade or use an alternative browser.
You should upgrade or use an alternative browser.
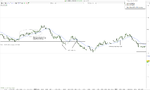
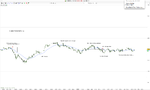
Today's trading. EURUSD ranging throughout US morning session.
What would be an average of the time you keep a position open...?
I am curious because a sometimes understand that you keep them for longer ...
JRS
Member
- Messages
- 59
- Likes
- 23
What would be an average of the time you keep a position open...?
I am curious because a sometimes understand that you keep them for longer ...
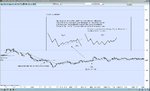
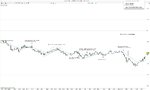
On average, they're between 1-10 mins. I shoot for 10 pips just as Bob describes. Sometimes I exit early if there's good technical grounds to. I note my losses with a dotted line (tipping point) getting broken by price. Otherwise, the winners I just show the entry.
I've been keeping some data on a couple other exit strategy ideas: a +/-10 pip bracket (win=10 pips, loss=-10 pips) and a trailing tipping point. Trailing tipping point is essentially never having a take-profit and trailing the trade with the tipping point technique described in FPAS. I'll post the results at the end of this month for the curious.
This sounds interesting. i have been looking at scalping for a while now, but i always figured there was too much noise for any price action setups. Seems like some people scalp really well, i don't, not yet anyway 🙂
This strategy reminds me of the petefader strategy on babypips http://forums.babypips.com/candlest...1475-supply-demand-vsa-wyckoff-petefader.html
JRS
Member
- Messages
- 59
- Likes
- 23
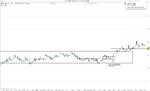
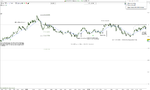
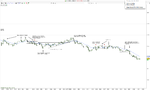
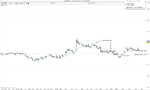
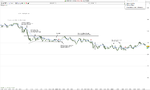
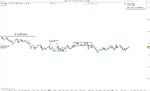
Took a few trades today. Happy trading, enjoy the weekend!
Edit: A note on the 3rd trade - I could have trailed a little higher up when the price pierced the EMA. My personal preference is to give the trade a little more room though. In this case, I scratched for a bigger loss but over time I've found I also get shaken out less.
Edit: A note on the 3rd trade - I could have trailed a little higher up when the price pierced the EMA. My personal preference is to give the trade a little more room though. In this case, I scratched for a bigger loss but over time I've found I also get shaken out less.
Attachments
JRS
Member
- Messages
- 59
- Likes
- 23
This sounds interesting. i have been looking at scalping for a while now, but i always figured there was too much noise for any price action setups. Seems like some people scalp really well, i don't, not yet anyway 🙂
Hi Moyes, there can be a lot of noise as well as false/tease breaks. That's why Bob (and other scalpers) put so much emphasis on seeing the build-up before jumping in a trade. Like anything else, it of course takes a lot of practice to learn how to recognize the right conditions. Good luck!
JRS
BLS
Established member
- Messages
- 642
- Likes
- 229
Week 28 charts from Volman:
https://www.dropbox.com/sh/1amxmi9af0fk6ej/VA5_ZrjQF1
https://www.dropbox.com/sh/1amxmi9af0fk6ej/VA5_ZrjQF1
Hi JRS, Nice trades.
That lack of taking into account the longer-term view of the market is, in MHO, B.V's method major flaw. Yes, that adds an extra level of complexity, but hey...trading is not easy.
My scalping has improved quite a lot since I started trading taking some kind of bias from the higher TFs (M5-M30). When I don't see a clear bias on a HTF, I sit on my hands.
Cheers
one can pickup a HTF bias by simply using a much larger mov ave. to make the math simple to understand. lets say you are using a 20 ma on 1 min bars. and you want a bias from 5 min bars. well you might try 100 ma which would represent the 20 ma on a 5 min bar.
but you do not have to know what it represents. simply take what you have and multiply but 3 to 5 to get the next up higher time frame. so 60 to 100 should work for standard 20 bar mov ave to the next higher time frame.
so if you use 20 ma on 70 ticks just use 60 to 100 for the next higher time frame bias.
if you go much larger than 5 times or 100 bars you might skip over some things. just throw something up and see what you like. that is the most important. use what you like.
there is not a need to have a 2nd chart with 5 min bars or more ticks. the standard chart is all that is needed with a larger moving ave.
of course use what you are comfortable with.
Thanks Jingles for your reply.
However, I'm not only interested on the HTFs for the trend bias but more importantly on the price action and price structure on such TFs. I want to see how price has reacted on the previous Highs/Lows, possible areas of supply/demand, possible weak or strong S/R areas, etc. I scalp regardless of the trend, so with that info I can have a higher probability of my trade working out on the fast TFs.
I learned the lesson of not only trading with the trend from trading B.V method a while back as most of the time I'd be taken out by pullbacks against the prevailing trend.
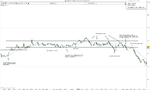
Bye the way I was looking at the daily bar chart of euro and it looks like it is in bear market still. I was thinking how nice it would be to have shorted it way up there. many thousands of dollars up in the sky. hahahaha.
no I confess. I am not trading. I am trying to learn. but I have turned my nose to the grindstone recently and feel I am making progress toward that day when I finally pull the trigger and hope it does not blow up in my face. hahaha.
no I confess. I am not trading. I am trying to learn. but I have turned my nose to the grindstone recently and feel I am making progress toward that day when I finally pull the trigger and hope it does not blow up in my face. hahaha.
JRS
Member
- Messages
- 59
- Likes
- 23
cha-ching
Active member
- Messages
- 148
- Likes
- 9
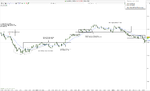
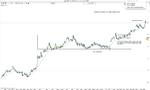
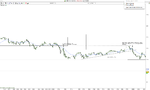
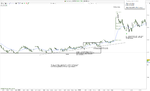
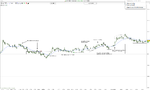
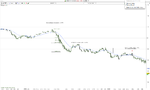
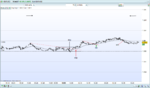
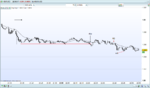
Aggressive today. Trending days do require a little more aggression, however, my last trade was esp way too much. Overall, a good day.
JRS
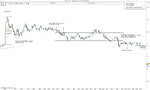
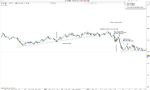
Nice charts, and good observation re: wedge. Volman described "flag traps" in one of his earlier charts, but it's for reversals. Good to know it can be applied to range breaks as well.
Attachments
JRS
Member
- Messages
- 59
- Likes
- 23
Nice charts, and good observation re: wedge. Volman described "flag traps" in one of his earlier charts, but it's for reversals. Good to know it can be applied to range breaks as well.
Thanks Cha-Ching! Nice find on Volman's thoughts about wedge reversals, thanks for posting!
JRS
Member
- Messages
- 59
- Likes
- 23
JRS
Member
- Messages
- 59
- Likes
- 23
garageboyFUJI
Member
- Messages
- 66
- Likes
- 0
Similar threads
- Replies
- 15
- Views
- 9K