Bob Volman Price Action Scalping

Trying to make it mine

Trying to apply BV real-time... and seeing a lot of stuff after the market closes. Comments say Euro but it's the Pound.

Some trivia on why the "curly L" symbol for the Pound.

http://en.wikipedia.org/wiki/Pound_sign
 

Attachments

  • Screenshot from 2015-05-11 21:50:55.png
    Screenshot from 2015-05-11 21:50:55.png
    127.9 KB · Views: 216
I have found that during open sessions the 5 min chart doesn't conform to a way I can see important clustering but after hours it does. During trading sessions the tick charts are more useful because they seem to keep a similar shape unless something is happening - they either get bigger or go into doji mode. And when you see 4 dojis you know you are in the right place. Dojis seem rare in a straight 5 min chart during the session but after hours they do appear.
 
Last edited:
I have found that during open sessions the 5 min chart doesn't conform to a way I can see important clustering but after hours it does. During trading sessions the tick charts are more useful because they seem to keep a similar shape unless something is happening - they either get bigger or go into doji mode. And when you see 4 dojis you know you are in the right place. Dojis seem rare in a straight 5 min chart.

What platform are you using? If it's NT most likely is due to the issue with NT7 I reported a while ago.
 
Yes I am...is there a link to this issue?

Check my post #3116. It's a big bug on NT7 as mentioned there. Basically on tick charts NT7 sucks(n). On time based charts you have to right click on the chart and click "Reload All Historical Data". I had reported the issue to the development department from NT and they said it would be fixed on NT8. I saw the NT8 beta version has just been released. Hope they did fix it.
 
Check my post #3116. It's a big bug on NT7 as mentioned there. Basically on tick charts NT7 sucks(n). On time based charts you have to right click on the chart and click "Reload All Historical Data". I had reported the issue to the development department from NT and they said it would be fixed on NT8. I saw the NT8 beta version has just been released. Hope they did fix it.

It is good to know I am not loosing my mind! It just didn't make sense to me.

Thanks for the information - I'm glad I joined this forum.
 
Last edited:
It is good to know I am not loosing my mind! It just didn't make sense to me.

Thanks for the information - I'm glad I joined this forum.
Yeah...it's weird so few traders have noticed that. I spent several days and emails explaining to NT7 support the bug, because even them couldn't see it (didn't want to see it?).
If you're beginning to learn B.V method, you're better off using PRT. With it the setups can be seen clearly. And hopefully after a while, you'll arrive to the same conclusion I did.

I came to the same conclusion...thanks for the reinforcement.(y)
 
Hi guys I am new to T2W. I am reading his 2nd book. How can I find a discussion on the 2nd book and also hopefully charts on 2nd book. 70 ticks is kind of fast for me.

I find the book very slow reading but definitely a super good book.

I have read some of book 1 but since I switched to book 2 I forgot some of the technical details of book 1. I probably want to stick with book 2 because I like the 5 min bars better than the high speed of 70 ticks.

I am surprised that the 2 methods are so different.

I have been a student of ES more than Forex. and I have of course read some of Al Brooks but I find Bob easier to understand what he is doing. I like the way Bob presents his ideas. He is good at explaining things.

I hope I can get some of Bob Volmans charts on this 2nd book methods. I really need up to date charts to study. Old charts are not as good because I can not pull them up on NinjaTrader.

Are there any applications that people have for NinjaTrader.
 
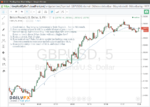
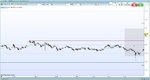
When I started to study FPAS, I setup NinajaTrader and PRT as they seem sort of the professional choice for tick charts. Much to my dismay, I noticed a huge difference between both of them. PRT works well all of the time, but Ninjatrader had a very much slower way of printing the bars and many B.V's setups are not seen properly or completely missed. I raised the question to NT support and after several emails and discussions, they acknowledged that there is a big issue on Ninjatrader 7 and TICK CHARTS ARE NOT PROPERLY DISPLAYED ON REAL TIME. They said they can't do nothing about it on the current release (I couldn't believe such stupid answer from support) and that they will try to fix it on NT8. If I were a paying customer I would request a refund.
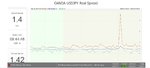
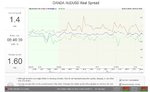
In case you're wondering, it has nothing to do with the data feed. NT uses FXCM's data feed which is the same they use for Kineticks which is supposedly very reliable. I proved NT's support that the issue is the program itself and not the the data feed.
So, new comers, stay away from NinjaTrader is you want to start to see those textbook setups seen on B.V's book. I found that even the MT4 EA for tick charts work pretty well and you can use it instead of PRT.

WOW This explains the problems I have had with NT7. Bye the way. I have pointed out problems and they fix NOTHING they do not want to hear about problems.

Yes Bob's 70 tick charts on NT7 do not look like Bob's charts. I gave up on book 1.

I now am working on book 2 using 5 min bars on NT7.

I hope that Bob makes available 5 min charts that I can look at. I need something that is up to date so I can view the charts and setups on my NT7 charting software and make sure I am viewing things correctly.
 
CAD news impact on USDJPY

Hi,

I have a question for those who trade USDJPY: do you avoid trading during CAD news? I used to trade EURUSD only and found there was minimal impact. Today I took a USDJPY trade just before CAD news (which I did not know in advance). The trade quickly went to my desired direction. Then I found OANDA widened the spread (even before my trade was closed).

The news was Wholesale Sales m/m released at 7:30 my time (12:30 PM GMT).

AUDUSD and EURUSD were not affected.

Thanks for your input.

Cha-ching
 

Attachments

  • USDJPY.jpg
    USDJPY.jpg
    243.9 KB · Views: 240
  • 20150520_USDJPY_spread.jpg
    20150520_USDJPY_spread.jpg
    119.4 KB · Views: 183
  • 20150520_AUDUSD_spread.jpg
    20150520_AUDUSD_spread.jpg
    198.3 KB · Views: 160
  • 20150520_EURUSD_spread.jpg
    20150520_EURUSD_spread.jpg
    207.2 KB · Views: 199
Hi,

I have a question for those who trade USDJPY: do you avoid trading during CAD news? I used to trade EURUSD only and found there was minimal impact. Today I took a USDJPY trade just before CAD news (which I did not know in advance). The trade quickly went to my desired direction. Then I found OANDA widened the spread (even before my trade was closed).

The news was Wholesale Sales m/m released at 7:30 my time (12:30 PM GMT).

AUDUSD and EURUSD were not affected.

Thanks for your input.

Cha-ching

What is your point here? Is there a correlation and if there is between what and when? let us in on what you discovered.
 
Hi, I have read both books and take them with me just about every where I go. At first pass, the books seem drastically different, but after several readings, I am finding that there is quite a bit of similarities between the 2 books.
 
Thanks for your reply Panjm. Actually 1.3157 would be the stop level of the SB entry (the bar after bar #3). So the stop of the second trade would be even more awkward, no?

RE: Fig 13.10 FPAS "Awkward Stop"

Since it's hard to see the exact level of price in the book, for the sake of argument lets call the top of the 1st ARB/IRB trade (1) at 1.3157, and the bottom of the pullback labeled 2 as 1.3159, and the bottom of the deeper pullback labeled 3 as 1.3158.

The trade taking out the signal bar at 2 was deemed a little aggressive with an awkward stop because there was a chance that price would put in a deeper pullback to support of the top of the ARB/IRB at 1.3157. BV says to sell below support. Had the trade at 2 been taken with the stop at 1.3159, then should price take out the stop you'd be selling in support rather than below support at 1.3157.

The trade at 3 was more promising because it pulled back a little deeper than at 2, still not all the way back to 1.3157 for a proper barrier test, but then broke a 2nd time in the direction for continuation. The 2nd break is the markets way of saying it doesn't need to retrace deeper before moving up again. The stop for the trade at 3 can be placed at 1.3158 because the new higher support is the flag resting on the top barrier of the bigger range. The low of that flag is of course 1.3158, and as BV points out, we sell/scratch below support.
 
Trading journal

Hi friends,

I have been trading Bob's PAS system for a while but the results are mediocre. So, I decided to post my trades on this thread for discussing and keep it as a trading journal. So if you're interested in you can come and discuss. This is my first note this morning EU session.
 

Attachments

  • ScreenHunter_138 Jun. 04 10.30.jpg
    ScreenHunter_138 Jun. 04 10.30.jpg
    149.1 KB · Views: 264
  • ScreenHunter_138 Jun. 04 10.41.jpg
    ScreenHunter_138 Jun. 04 10.41.jpg
    121.5 KB · Views: 201
Hi friends,

I have been trading Bob's PAS system for a while but the results are mediocre. So, I decided to post my trades on this thread for discussing and keep it as a trading journal. So if you're interested in you can come and discuss. This is my first note this morning EU session.

Hi,

Please see my comments on your first trade of last Thursday.
 

Attachments

  • $EURUSD (200 Tick)  4-6-2015.jpg
    $EURUSD (200 Tick) 4-6-2015.jpg
    154.9 KB · Views: 313
Top