You are using an out of date browser. It may not display this or other websites correctly.
You should upgrade or use an alternative browser.
You should upgrade or use an alternative browser.
cha-ching
Active member
- Messages
- 148
- Likes
- 9
Your best bet would be ProRealTime but that doesn't come cheap. Others have used the 30 second chart from OANDA with some success.
More charts from Bob:
Hi BLS,
One trade I forgot to ask you.
http://www.trade2win.com/boards/att...an-price-action-scalping-untitled-picture.png
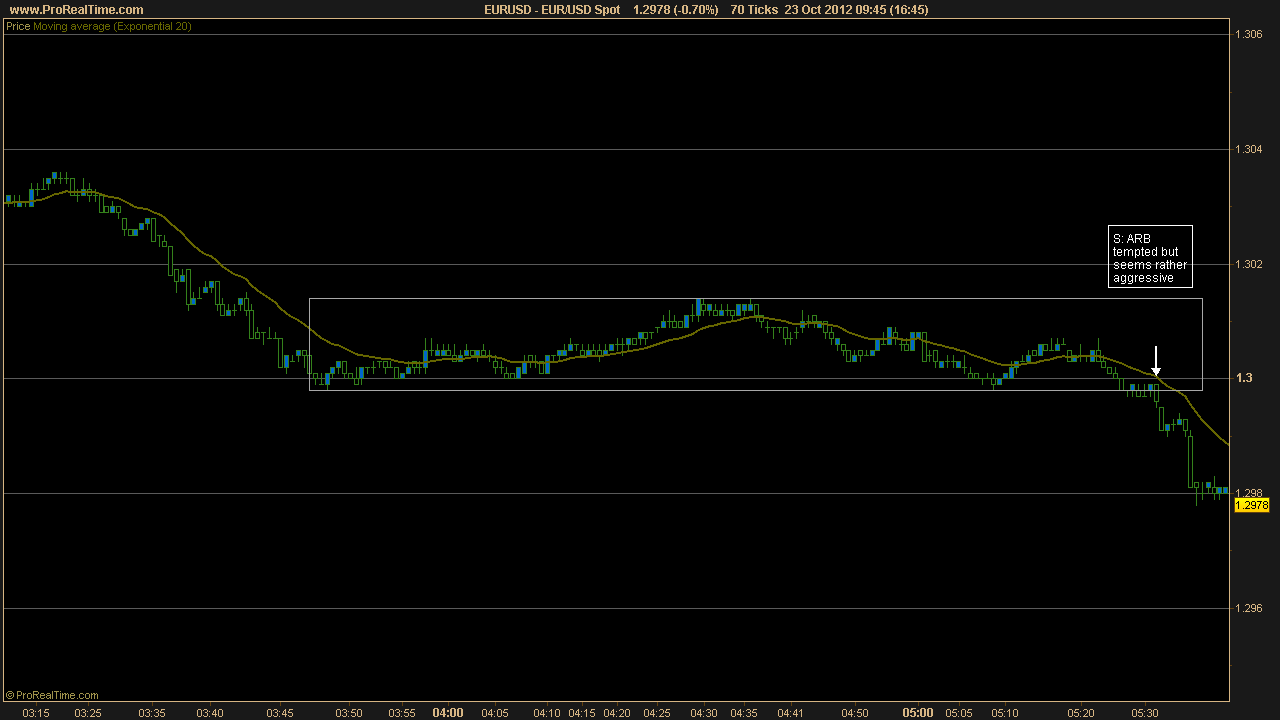
Why you think this ARB was too aggressive? BTW Bob didn't mark this one. I thought it's a good trade though I just watched the market Tuesday due to tiredness from something else.
Thank you!
BLS
Established member
- Messages
- 642
- Likes
- 229
Hi BLS,
One trade I forgot to ask you.
http://www.trade2win.com/boards/att...an-price-action-scalping-untitled-picture.png
Why you think this ARB was too aggressive? BTW Bob didn't mark this one. I thought it's a good trade though I just watched the market Tuesday due to tiredness from something else.
Thank you!
This is all in the context of the 00 level:
1) Weak bottom barrier
2) Prices came down from the middle of the range and did no bounce between the barrier (broken or not) and the 20 EMA
3) The break of the setup seemed hasty
I just like to exercise more caution for trades around the 00 levels. I don't always remember to but that's what I would want to do.
Forgot to post my charts from Friday. Seems a bit pointless now that Bob has given us his charts but maybe someone would find it useful? I guess I'll post them in case shotgun has the time to do his analysis of who took what trades that Bob spotted.
Attachments
stehlikpetrmsncom
Active member
- Messages
- 194
- Likes
- 3
Thank you for the charts again BLS and Bob. They are extremely helpful.
Your best bet would be ProRealTime but that doesn't come cheap. Others have used the 30 second chart from OANDA with some success.
More charts from Bob:
Thank you for your answer, but I noticed that OANDA offers spreads not so cheap. Do you know a more competitive broker that offers the cheapest spread on EUR/USD?
Maybe the best solution is to use the chart in ProRealTime and trade with the cheapest broker in the market.
Thank you again for your attenction
Yorkshire Terrier
Established member
- Messages
- 620
- Likes
- 73
Hi everyone, I am new in this forum and new in this forex world, I am reading this book and I would like to know where to find the tick chart to trade with BOB's method. Do you hany suggestions?
Thank You
Hi BLS
I use Ninja trading with 70 tick and single pip charts as apposed to pipets as it suggests when setting up the installation.
I also use MB tradings demo account as the dater feed both are free to use, for how long I'm not sure but iv been using this
combo for three weeks now.
You will need to set up a MB trading account before you download ninja hope this helps.
Yorkshire Terrier
Established member
- Messages
- 620
- Likes
- 73
sorry last massage was directed at wrong member should have been for mindset74...appolages.
stehlikpetrmsncom
Active member
- Messages
- 194
- Likes
- 3
Question for Prorealtime users:
I'd like to draw rectangles instead of lines during live trading, but it doesn't allow me to draw past the last (newest) bar. Did anybody find a way around it?
I'd like to draw rectangles instead of lines during live trading, but it doesn't allow me to draw past the last (newest) bar. Did anybody find a way around it?
BLS
Established member
- Messages
- 642
- Likes
- 229
Question for Prorealtime users:
I'd like to draw rectangles instead of lines during live trading, but it doesn't allow me to draw past the last (newest) bar. Did anybody find a way around it?
Nope. I just use line segments and have it extend indefinitely to the right by default. I don't like using the regular line tool because I don't like seeing the line extending to the left indefinitely.
cha-ching
Active member
- Messages
- 148
- Likes
- 9
Question for Prorealtime users:
I'd like to draw rectangles instead of lines during live trading, but it doesn't allow me to draw past the last (newest) bar. Did anybody find a way around it?
I don't think you can. Also it cannot draw vertical lines between wicks like NinjaTrader does, that's why I use dotted lines to draw boxes. Don't know if it will change in version 10.
cha-ching
Active member
- Messages
- 148
- Likes
- 9
I have a question regarding ProRealTime too:
https://www.prorealtime.com/en/help-manual/dde-data-export
Has anybody figured out how to do DDE data export? Thanks.
https://www.prorealtime.com/en/help-manual/dde-data-export
Has anybody figured out how to do DDE data export? Thanks.
Giorrgi
Well-known member
- Messages
- 253
- Likes
- 0
Hi BLS
I use Ninja trading with 70 tick and single pip charts as apposed to pipets as it suggests when setting up the installation.
I also use MB tradings demo account as the dater feed both are free to use, for how long I'm not sure but iv been using this
combo for three weeks now.
You will need to set up a MB trading account before you download ninja hope this helps.
I finally managed to setup the charts ! Hellzyeah, now I finally have a chart thats moves in pips instead of pipettes. i'm not sure however that the data feed is very reliable, will have to check with it with prorealtime charts.
cha-ching
Active member
- Messages
- 148
- Likes
- 9
I finally managed to setup the charts ! Hellzyeah, now I finally have a chart thats moves in pips instead of pipettes. i'm not sure however that the data feed is very reliable, will have to check with it with prorealtime charts.
It's not very reliable. You'll have to reload from time to time. I believe samich had similar problem. You may also need to change the number of ticks, I remember it's around 100 when I tested this a month ago. The reason I quit this approach is that one morning just before NY open MBTrading's data feed stopped for about 5 - 10 minutes. Maybe it's better if you have a live account at MBTrading 'coz it uses a different server.
Giorrgi
Well-known member
- Messages
- 253
- Likes
- 0
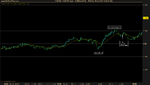
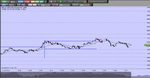
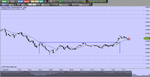
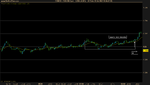
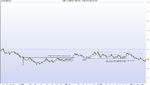
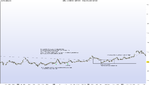
I'm gonna go ahead and post my charts for today.... Pretty rough day, or is it just me?
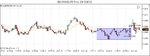
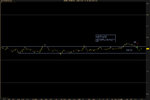
For the last chart I switched to Ninjatrader which uses pips instead of pipettes. But as a cha-ching said it might not be very accurate.
There's probably some issues with the tipping point technique since I haven't reread the chapter so I think my exit point are crap.
The first range break was counter-trend, but the trend that preceded it wasn't exactly very powerful, therefore I thought the range (which was about as long as the trend itself) would take off but it didn't.
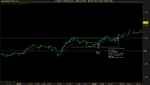
The second range wasn't a very good trade: the range wasn't as tall as I would like it to be and the price action didn't really establish the upper barrier as a strong resistance. Also, Pathfinder's live feed isn't great so this might've looked completely different on prorealtime.
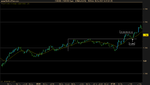
The 3rd trade was a picture perfect block break (at least to me).
For the last chart I switched to Ninjatrader which uses pips instead of pipettes. But as a cha-ching said it might not be very accurate.
There's probably some issues with the tipping point technique since I haven't reread the chapter so I think my exit point are crap.
The first range break was counter-trend, but the trend that preceded it wasn't exactly very powerful, therefore I thought the range (which was about as long as the trend itself) would take off but it didn't.
The second range wasn't a very good trade: the range wasn't as tall as I would like it to be and the price action didn't really establish the upper barrier as a strong resistance. Also, Pathfinder's live feed isn't great so this might've looked completely different on prorealtime.
The 3rd trade was a picture perfect block break (at least to me).
Attachments
BLS
Established member
- Messages
- 642
- Likes
- 229
I'm gonna go ahead and post my charts for today.... Pretty rough day, or is it just me?
They announced the closure of some US financial markets (NYSE, NASDAQ, CBOE, bond market) because of Hurricane Sandy. I decided not to trade today although there was a possible (though a bit questionable) opportunity during the US session. Stock market might be closed tomorrow too depending on the conditions.
Attachments
shotgun77
Active member
- Messages
- 128
- Likes
- 2
From Marketwatch.com:
U.S. stock exchanges will remain closed on Tuesday while Hurricane Sandy hits the East Coast, said NYSE Euronext (NYSE:NYX) , the parent of the New York Stock Exchange. The closure will be in coordination with all U.S. equities, bonds, options and derivatives markets, the company said in a release. The intention is to reopen on Wednesday, conditions permitting.
stehlikpetrmsncom
Active member
- Messages
- 194
- Likes
- 3
I use Oanda and their spreads aren't terrible. Usually 1.1 pips during regular hours and non-volatile events. Bob suggests anything below 1
Thank you for your answer, but I noticed that OANDA offers spreads not so cheap. Do you know a more competitive broker that offers the cheapest spread on EUR/USD?
Maybe the best solution is to use the chart in ProRealTime and trade with the cheapest broker in the market.
Thank you again for your attenction
Similar threads
- Replies
- 15
- Views
- 8K