Bob Volman Price Action Scalping

Aggressive entry or just unlucky?

Will be grateful for any comments.

Hi,

Your outside range is 13 pips in height, not much room from either bound. Bob mentioned it should be close to 20. In the charts from his IRB chapter most are 20+ wide, with the exception of a few with strong trend preceding the box.

I haven't reviewed many trades in this forum, please let me know if my understanding is wrong.
 
Aggressive entry or just unlucky?

15508x1.png


Will be grateful for any comments.

The overall pressure inside the range isn't too clear to me. Yes we have some higher lows but they're not very distinctive. I don't see anything...obvious to me that would suggest that the bulls were winning. Can you point some clues out (besides the higher double bottom, doesn't seem like enough to me)? I'm curious because I might just be biased.

Sonatine is correct in pointing out that IRB setups like these usually have a (strong) trend at the beginning of the chart, though the 20 pip range thing usually applies to the barrier bounce variety of IRBs.
 
Last edited:
I've added a bit more of earlier price action to the chart. The yellow box shows the initial range I was watching. Here you can see the price bouncing back to the top barrier from higher and higher levels making and retesting higher lows. After the yellow box didn't break to the upside I thought it would be right to readjust the top barrier level. But the overall buying pressure seemed to be intact to me.

152dmb5.png


Thank you for the comments. Considering how prolonged the range was, I thought if I could get into the market at the point when one of the sides gives up there would be enough momentum to reach my target. Hence some flexibility with the size of the range.

Hmm, guess I'd have to say that trading that setup was too aggressive given the overall price action preceding it. Yes I can see the buying pressure but it probably wasn't enough to make the bears bail at that point.
 
Hello,

Hope everyone's trading going well. Haven't had any luck trading BB as a continuation of a trend. The chart below looks like a typical squeeze with a bullish breakout and I thought that this block represented some hesitation below the 20 level. Does anyone use any "filters" for BB trades in a trend?

dr2now.png


Many thanks.
 
Hmm, well I'm not sure if I'm the best person to comment on this because I'm still in the process of trying to figure this out too, but I would say the range didn't have enough pressure built up when it broke. I have noticed trades like this bounce frequently if they didn't come after a proper RB setup. Usually if the RB does have enough pressure, a retest of the breakout level isn't always necessary. In this case the BB itself might be a good setup had the price come down to test that breakout level right below 1.2310 first and then gone back up. The potential RB here probably took off because it had established round number support, but it still doesn't have the kind of pressure that I would like to see to start a good uptrend. Any setup after an IRB or a weak looking RB, I like to see a retest. Otherwise I would view that BB setup more as a sign of resistance than a valid setup. However, if I had seen a third higher low within the box of the BB, I might be willing to take a trade on a break. Or if it had pulled back to the breakout zone and given us an ARB, I'd take that too.
 
Well I goofed up this morning, lol. I took this RB (which I'm not sure it had the best buildup) into a round number zone. It definitely needed one more lower high going into a round number zone, but I had just woken up, glanced at the chart and forgot to check the levels before I got in. I guess I treated it as a BB which was the wrong way to approach it, because it was obvious that I should've been looking at it like an RB or waiting for an IRB.

Two questions about this trade.
1. Should my tipping point have been the bottom of the range? I waited until it passed that last high within the range before the breakout, but that was like a 7 pip loss. Stupid on my part. There were plenty of good touches on that RB line that I feel like if it didn't hold up, I should have cut it. If there was a tighter push before the barrier broke, maybe I could have stayed in.
2. If it wasn't in a round number zone, should I have taken this trade?

Next, I missed that IRB which I spotted, but decided not to take. I think this was a better setup than the first because the box contained four lower highs.

Then I missed the 2nd break of the box. You can see five lower highs and a couple double tops before the RB broke, so even though it doesn't compress a ton at the barrier level, it really doesn't get more bearish than that. This was probably the easiest setup on the chart.

Then finally I missed an IRB. The stop wouldn't have been that economical so I didn't like it. I spotted it, but was just too slow to evaluate the positives/negatives of the setup. Still, it's probably one of the most risky setups in this chart. After looking at it, it has round number support and is at a third higher low. There are basically 2 double bottoms before it (not quite, the bottoms of both of them are 1 pip apart, but still...) I did not like that top at 6:15 and that's the main reason I didn't take this trade. Yes, it was 3 hours before, but it was within 200 bars on the chart. I can't decide what my default should be and am still trying to figure that out. Since the market has been a bit slower lately, I am not sure if I should still disregard everything past the last 2 hours even if it's only, say 100 or 150 bars on the chart.

Yesterday I clicked Buy on a valid SB setup, but had some computer problems and it didn't execute. Bummer! That would have me in the positive this week, but right now I'm sitting at 0-1. I am feeling good about my progress with identifying IRB's and BB's though. That's been my week area and I feel like I am seeing a gigantic improvement.

If anyone has any thoughts on these setups let me know, the feedback on this forum has helped me a lot and I've only been on here for a week. So I would just like to say thanks. Had I played this chart correctly, it could have been a very nice morning. I am sure it will come with experience.
 
Hmm, well I'm not sure if I'm the best person to comment on this because I'm still in the process of trying to figure this out too, but I would say the range didn't have enough pressure built up when it broke. I have noticed trades like this bounce frequently if they didn't come after a proper RB setup. Usually if the RB does have enough pressure, a retest of the breakout level isn't always necessary. In this case the BB itself might be a good setup had the price come down to test that breakout level right below 1.2310 first and then gone back up. The potential RB here probably took off because it had established round number support, but it still doesn't have the kind of pressure that I would like to see to start a good uptrend. Any setup after an IRB or a weak looking RB, I like to see a retest. Otherwise I would view that BB setup more as a sign of resistance than a valid setup. However, if I had seen a third higher low within the box of the BB, I might be willing to take a trade on a break. Or if it had pulled back to the breakout zone and given us an ARB, I'd take that too.

I agree with your analysis. I don't think the market was trending at that point. Yes, you have those distinct highers lows but I still see it as a round number fight that the bulls won when the range broke. I actually took that range break because I thought there was enough build up.

I would like to clarify. We have clear upward pressure. We have a clear signal line (almost perfect). There is no visible chart resistance (except maybe some remnants from the far left). Prices remained above the 00 level, which was nice but not entirely necessary. And we have a bit of a squeeze before the break. It seemed obvious to me but if it didn't seem that way to you, don't worry. This is my personal view and just because I saw it doesn't mean you have to see it too. There's a lot of leeway in how you can trade Volman's method because there's no way of telling which way is the "right" way (assuming you don't take obviously bad trades like I did on Tuesday, see E2 and E3 from 8/7).
 

Attachments

  • USD Spot.png
    USD Spot.png
    14.3 KB · Views: 336
Last edited:
RBs of doom.png
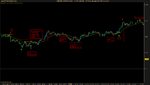
well i goofed up this morning, lol. I took this rb (which i'm not sure it had the best buildup) into a round number zone. It definitely needed one more lower high going into a round number zone, but i had just woken up, glanced at the chart and forgot to check the levels before i got in. I guess i treated it as a bb which was the wrong way to approach it, because it was obvious that i should've been looking at it like an rb or waiting for an irb.

Two questions about this trade.
1. Should my tipping point have been the bottom of the range? I waited until it passed that last high within the range before the breakout, but that was like a 7 pip loss. Stupid on my part. There were plenty of good touches on that rb line that i feel like if it didn't hold up, i should have cut it. If there was a tighter push before the barrier broke, maybe i could have stayed in.
2. If it wasn't in a round number zone, should i have taken this trade?

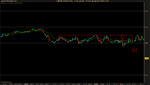
Next, i missed that irb which i spotted, but decided not to take. I think this was a better setup than the first because the box contained four lower highs.

Then i missed the 2nd break of the box. You can see five lower highs and a couple double tops before the rb broke, so even though it doesn't compress a ton at the barrier level, it really doesn't get more bearish than that. This was probably the easiest setup on the chart.

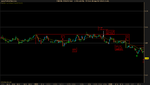
Then finally i missed an irb. The stop wouldn't have been that economical so i didn't like it. I spotted it, but was just too slow to evaluate the positives/negatives of the setup. Still, it's probably one of the most risky setups in this chart. After looking at it, it has round number support and is at a third higher low. There are basically 2 double bottoms before it (not quite, the bottoms of both of them are 1 pip apart, but still...) i did not like that top at 6:15 and that's the main reason i didn't take this trade. Yes, it was 3 hours before, but it was within 200 bars on the chart. I can't decide what my default should be and am still trying to figure that out. Since the market has been a bit slower lately, i am not sure if i should still disregard everything past the last 2 hours even if it's only, say 100 or 150 bars on the chart.

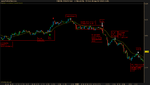
Yesterday i clicked buy on a valid sb setup, but had some computer problems and it didn't execute. Bummer! That would have me in the positive this week, but right now i'm sitting at 0-1. I am feeling good about my progress with identifying irb's and bb's though. That's been my week area and i feel like i am seeing a gigantic improvement.

If anyone has any thoughts on these setups let me know, the feedback on this forum has helped me a lot and i've only been on here for a week. So i would just like to say thanks. Had i played this chart correctly, it could have been a very nice morning. I am sure it will come with experience.
 
I agree with your analysis. I don't think the market was trending at that point. Yes, you have those distinct highers lows but I still see it as a round number fight that the bulls won when the range broke. I actually took that range break because I thought there was enough build up.

Yeah, it might have enough buildup according to some of the textbook RBs. I kept messing up on RBs a few weeks ago, but looking back, it was mostly because the RBs that I picked had equal highs or lows before the breakout, but no increase in pressure. For example, if I were going to short a breakout RB, I would now want to see like 3 lower highs before the break. I think this setup had that. The one I took this morning had 3 lower highs, but it was into a round number zone that had clear buying interest. Oops!
 
Ok, I feel like I'm clearly missing a point. When one uses term "trend" trading off 70t chart, what does it suppose to mean? I've noticed that my with trend trades often fail probably because of my wrong interpretation of the trend itself.

2yv9wgh.png


Will appreciate any feedback.
 
Resistance.gif

This situation might answer my last question. I saw this RB in AUS/USD. There was resistance about 5 hours back but still within 200 bars. Price still turned around when it got close to that top even though it occurred hours before. Had I actually taken this trade, I probably would have cut it at a break of the 9:49 low, and that would have had me breaking even. Normally I'd let a good RB come back for a retest, but price action after the break was blocky. If price did retest the breakout level, it would have to mow through that blocky price action and I thought it was more likely to travel back inside the range. If price just came back down and tested the breakout level without making that blocky price action, I would have stayed in. I guess with that approach it might be worth taking this RB, I really can't decide. It even comes after an inverted head and shoulders pattern and a triple bottom, so it was probably a safe bet, just have to manage it cautiously.
 

I spotted those setups too.

Arrow 1: The first one was failed RB. I think it was a good trade with a bad outcome, though there was some confusion on my part on whether to enter at 99 (range bottom but break of a possible IRB setup) or 98 (break of range bottom). It looked good on the ProRealTime chart, but yeah, looks sketchy on yours; I'd think twice before trading that one unless it had stronger downward pressure, even if it was still around the 00 level. Take a look at E1 on my chart. I don't see how you could've lowered the tipping point on this trade.

Arrow 2: For the second setup, that was shorting into obvious support but that block was a clue to a downside break seeing as the bulls were unable to break to the upside. I'd skip this one because there isn't enough room for a 10 pip scalp.

Arrow 3: Excellent trade but it wasn't obvious until the break of that (skipped) IRB barrier bounce. There was a strong response from the bulls at the bottom of the range but the bears capped prices under the EMA. Very bearish clues. We have downward pressure, very nice tension/squeeze, and a nice signal line. See E2 on my chart.

Arrow 4: On my chart this was perfect RB trade. See my earlier post's chart, trade E3. I think you may want to experiment with some different tick values other than 70. Maybe decrease the number of ticks per bar, your chart seems to have less bars than mine in the same time frame. I'd skip this one if I was looking at your chart because I can't see the same level of build up as I can on ProRealTime's chart.

Don't think about how much money you could've made. It'll drive you nuts and possibly lead you to take less-valid/bad trades. What happened has passed. Just try to learn from your mistakes but don't think about what ifs.
 

Attachments

  • USD Spot1.png
    USD Spot1.png
    11.6 KB · Views: 326
  • USD Spot2.png
    USD Spot2.png
    13.4 KB · Views: 367
Ok, I feel like I'm clearly missing a point. When one uses term "trend" trading off 70t chart, what does it suppose to mean? I've noticed that my with trend trades often fail probably because of my wrong interpretation of the trend itself.

2yv9wgh.png


Will appreciate any feedback.

The concept of a trend is rather subjective. There are times when it's clearly obvious but when a trend is starting to form or if prices aren't moving as much, that's where it gets tricky. I can't give you a definite answer on how to spot a trend. All I can say is that you'll get a feel for it the more time you spend looking at the charts.

That trade you pointed out had nothing wrong with it. I skipped it myself because I was spooked by that huge move down after a session of prices ranging around the 00 level. I did not skip it for technical reasons, it was fear. This move confused me so I didn't try to trade it. I would say that the market was trending at that point.
 

Attachments

  • USD Spot3.png
    USD Spot3.png
    16.3 KB · Views: 1,002
Hey Vanica,

Well don't worry, I had a hard time figuring out when trends were starting or reversing at first too. Remember that the round number "zone" is just a general area. Stop/loss and buy orders could be sitting anywhere near the number, within a few pip. To me, that ranging action near 1.231 would make me start to turn bearish, but I would not have taken that trade because of the previous resistance at the 1.230 level. I would, however, be on alert for it to start trending if it passes through that resistance. It's all sort of relative, so that can make things hard at first. For instance, since it failed to crack that 1.232 level AND fell through resistance at 1.231, AND there's resistance at 1.230 if prices decide to try to go bullish again, that's an awful lot of obstacles for prices to get through. It would deter me from taking any bullish setup for awhile. Therefore, I would have probably taken that DD at 16:30. The pullback is right into the average and the countertrend is only about half as enthusiastic as that bearish trend before it. It's a beautiful pullback and for that reason, I think it's an easy target to get countered. Yes, it didn't retest the 1.230 level, but given that we have 3 possible resistance levels above that setup, I would have thought a retest wasn't necessary at this point. However, if we had not seen 2 previous bearish moves and so much resistance, I would have been concerned that there was no retest of the 1.230 level.

There's really nothing wrong with taking that last DD setup but there are a few things to be cautious of. There's some blocky price action to the left of the setup that could potentially act as support (and does actually, after that double bottom). Personally I might have been hesitant of that but the pullback is quite nice. The setup could still be taken but it takes careful management. I would have cut it before it got all the way back to the DD setup. Here's why: The double bottom would concern me, but I would not cut the trade right there. I would next see if that blocky price action before the setup becomes support. I would be on alert for another higher low, which we see a few moments later. Once I decide that price has made a higher low after a double bottom, I cut the trade immediately, especially in this case where that higher low is using some blocky price action as support. That would probably get you out of this trade for a break-even or 1 pip profit. If it establishes a higher low after a double bottom, that's a pretty good sign that people will start cutting their positions. Price would then have to break through two bottoms in order to proceed.

I'm still learning so don't take all my advice to a tee, double check it for yourself. I do hope this helps though!
 
View attachment 142390

This situation might answer my last question. I saw this RB in AUS/USD. There was resistance about 5 hours back but still within 200 bars. Price still turned around when it got close to that top even though it occurred hours before. Had I actually taken this trade, I probably would have cut it at a break of the 9:49 low, and that would have had me breaking even. Normally I'd let a good RB come back for a retest, but price action after the break was blocky. If price did retest the breakout level, it would have to mow through that blocky price action and I thought it was more likely to travel back inside the range. If price just came back down and tested the breakout level without making that blocky price action, I would have stayed in. I guess with that approach it might be worth taking this RB, I really can't decide. It even comes after an inverted head and shoulders pattern and a triple bottom, so it was probably a safe bet, just have to manage it cautiously.

Ok, you definitely need to lower the tick count per bar for your charts. See my attached chart (they are 2 hours behind yours). You should not have to worry about resistance from 5 hours ago; you chart show too much action too far back in time.

Trading the AUD/USD is a bit trickier because it doesn't move as much as the EUR/USD does so it might be harder to aim for 10 pip. I've noticed that the GBP/USD will sometimes move more than the EUR/USD but not always. I wouldn't have the patience to trade in such a slow environment.
 

Attachments

  • USD Spot0.png
    USD Spot0.png
    10.5 KB · Views: 291
BLS, Samich thank you very much for your great comments. I think that you are much more advanced traders and don't feel confident enough contributing to your analysis. Though I'm trying to get as much experience as possible at the moment and hope will be able to participate in you discussions soon.
 
BLS, Samich thank you very much for your great comments. I think that you are much more advanced traders and don't feel confident enough contributing to your analysis. Though I'm trying to get as much experience as possible at the moment and hope will be able to participate in you discussions soon.

You should try to join the discussion. It will improve your learning process. I find if helpful for myself to post my trade and analysis. It forces me to think about my trades more than usual. Try to be as detailed with your analysis of your trades as you can and you will start to notice/get a feel for things.

If your analysis differs from other people's that doesn't mean you are wrong. You might be missing some key clues but someone will point those out to you if that was the case. Then you'd learn mean. Or you just have a different view of the market that is backed up with clues that you spotted. That's fine. You can develop your own way to trade Volman's method.

Avoid doing your analysis while you are still trading. That will just leave you distracted from trading. Put aside some time before or after you trading session to review and analyze.
 
I spotted those setups too.

You are right, that's really bizarre about my charts not having as many bars. I wonder if they are not counting ticks correctly? I looked into ProRealTime a coupel of times. I decided to go the free route first, but maybe it'd be worth it. Is it very expensive? I'll mess with my charts some more and see if I can reconfigure it.

On your chart, that 1st RB would have spooked me because the tight pressure before the break is actually 1 pip higher than the previous block of pressure. It might not make any difference, but that's something that I have been skipping when I see it for now just to see if those breakouts are more prone to being countered.

You are right about that 2nd IRB, it's only within a 10 pip range. I made that mistake several times when I was practicing last week! Must get this stuff drilled into my head, hahaha. I still thought that setup had a pretty good chance and as long as it didn't crawl up past 1.2308 I might have been comfortable taking it since it could have had a fairly economical stop, but that might have been a bit risky.

Also, now I remember having my finger on the mouse for that 2nd RB but it broke so fast that I didn't want to take it. It instantly shot down like 5 pips and never came back for a retest. Bummer! Oh well. Even though it did travel quite a ways, waiting for an economical entry was probably the right decision.
 
BLS, Samich thank you very much for your great comments. I think that you are much more advanced traders and don't feel confident enough contributing to your analysis. Though I'm trying to get as much experience as possible at the moment and hope will be able to participate in you discussions soon.

Hey, don't worry, like 10 days ago I was taking some really dumb BB's that didn't look anything like the ones in the book. Hahaha.. I also couldn't see IRB's very well until like, late last week. One day things will just start to click a little bit at a time. On the weekends I scroll through the entire previous week's EUR/USD chart for practice, it has helped me improve a lot, and I usually come back on Mondays with a little more confidence.
 
Top