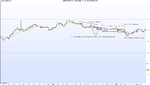
Just wanted to share this backtest that I did earlier.
I find that this is a common situation for me.
Everything seems to be falling into place, but ends up the entry I take usually fails.
Then it starts to move against me and hovers on the brink of exiting my trade, after which it usually does.
I just wanna see what comments everyone has. I know Bob always tells us to manage our stops properly and not be over zealous for a breakeven stop as prices usually crawl back to the breakout point before hammering down again.
I try to control my stoploss and usually try not to move my stops but many times, I wonder if I should have exited earlier since the 'inevitable' always happens and exiting earlier can save me a couple of pips.
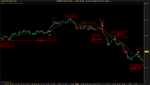
For my chart below:
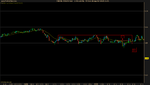
E1: attempted upside movement to 1.238 but failed. lower and lower highs, squeezing back to 1.236 bottom. The bullish attempts were often quickly defended by the bears, which prompted the entry after the 20EMA squeeze at 1.236. Prices move for a couple of pips, but reverse back into range, finally a false break and stopped out.
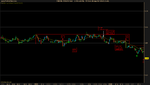
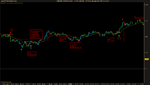
E2: The false break prompted movement downwards, indicating downward momentum intact. Because of the new low and the fast movement downwards which did not give enough pressure, earlier ARB entry was rejected until the 2nd red arrow. Price did jump, but not enough to reach target, after which price rebounded and formed an ascending triangle (aka BB), cleared the 20EMA and was stopped out.
Note that E2 reached a max of 6-7 pips, stopped neatly at 1.2350 before reversal.
Should a smaller target of 7 pips be set since we know that 1.235 is a round number zone?
I feel that all these small losses always hinder my account value and to my win-lose ratio.
I find that this is a common situation for me.
Everything seems to be falling into place, but ends up the entry I take usually fails.
Then it starts to move against me and hovers on the brink of exiting my trade, after which it usually does.
I just wanna see what comments everyone has. I know Bob always tells us to manage our stops properly and not be over zealous for a breakeven stop as prices usually crawl back to the breakout point before hammering down again.
I try to control my stoploss and usually try not to move my stops but many times, I wonder if I should have exited earlier since the 'inevitable' always happens and exiting earlier can save me a couple of pips.
For my chart below:
E1: attempted upside movement to 1.238 but failed. lower and lower highs, squeezing back to 1.236 bottom. The bullish attempts were often quickly defended by the bears, which prompted the entry after the 20EMA squeeze at 1.236. Prices move for a couple of pips, but reverse back into range, finally a false break and stopped out.
E2: The false break prompted movement downwards, indicating downward momentum intact. Because of the new low and the fast movement downwards which did not give enough pressure, earlier ARB entry was rejected until the 2nd red arrow. Price did jump, but not enough to reach target, after which price rebounded and formed an ascending triangle (aka BB), cleared the 20EMA and was stopped out.
Note that E2 reached a max of 6-7 pips, stopped neatly at 1.2350 before reversal.
Should a smaller target of 7 pips be set since we know that 1.235 is a round number zone?
I feel that all these small losses always hinder my account value and to my win-lose ratio.