Hi BLS, thanks for encouraging lurkers like me to participate. I'm new to trading, had a few months' demo experiences then stopped completely to study technical analysis and Volman's book. Right now I just finished the Second Break chapter.
I do have a few questions but was too timid to ask since I saw you guys posting advanced setups. Now that I've read your kind words, let me start with the following:
1. About ProRealTime. Volman mentioned that one should use a stand-alone package solely for charting purposes, and should not use the charts from the trading platform. I wonder why. What if the data feeds are quite different. Where does ProRealTime get the forex data? Are prices from ProRealTime similar to those from your broker? Do you use free access to ProRealTime (it mentions that smartphone can have real time data) or do you pay for the service?
2. One concern I have about tick chart is different brokers can have very different tick charts while time charts should be a lot more similar. What's your thoughts about this issue? Has anybody ever applied Volman's methods on 30 sec, M1 or M5 charts?
3. On FB. Is my understanding correct that "the first bar in a substantial pullback that gets taken out in the direction of the trend" (from page 61) means price should break at least 2 pip from the low or high of previous bar? This 2 pip thing was mentioned near the bottom of page 64 but never stated "officially" elsewhere.
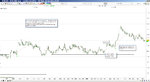
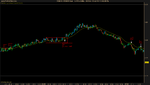
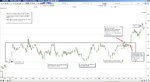
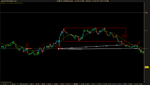
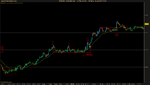
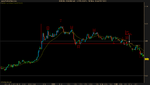
4. In Figure 9.2 (page 86) why is the first break skipped? The only reason I can think of is because of the round number 1.2850 but it applies to SB as well, besides Volman said it's obvious one should skip FB before he mentioned the RN issue.
Thanks in advance!
Welcome to the thread sonatine!
1. Volman recommends a standalone package because he doesn't want a scalper to be distracted by his profits and losses. By using a standalone package, a scalper can hide his broker platform window,thus hiding his current P/L and account balance (this is assuming you can find a platform with a "always on top" ticket window). I don't know the source of ProRealTime's feed but I do know that the prices are pretty close to my broker's (I am using Trader's Way) because I took the time to compare them. Volman suggests either using a different charting package/data feed or a different broker if you see (noticeable) differences between the two. ProRealTime's mobile package doesn't include the tick chart so you'd have to have a subscription. They do offer a one week free trial (no need to give them any credit card details).
2. This might be a reason why Volman suggests using a standalone charting package. While the price action principles are universal, his setups are less so. His setups typically require a signal line to trade off of, which is harder to determine when you don't have a charting platform that only shows candles in 1 pip increments. It is possible to use the 30 second chart but it's not ideal. You can check out the posts from Mike in this
thread where he uses the 30 second chart to trade (sorry, I don't know which broker he is using).
3. No. Prices just need to break the signal bar by one pip on the chart. The 2 pip break he mentions is about calculating the discretionary stop loss. Bob's method involves two stop. One is the 10 pip stop that is set when you enter a trade. Typically you won't need this 10 pip automatic stop, it's just there in case something goes wrong (computer crashes, loss of internet connection etc). What he was talking about on page 64 was calculating the desired stop loss, which is usually one pip below a signal bar (for a long trade). So if your signal bar is 5 pip tall, and you enter long on the break of it, your stop becomes 1 pip (for the break to the UPSIDE) + 5 pip (for the length of the candle) + 1 pip (for the break of the signal bar to the DOWNSIDE) = 7 pip. You don't have to worry much about this yet, he will explain this in greater detail in the Trade Management section.
4. The first break is skipped because it does not meet the requirement for a FB setup to come from the first pullback against a trend. The with trend move for the skipped first break came from an earlier pullback against the trend (from 3 to 4).
My advice to you, if you aren't already doing so, is to take notes as you read Bob's books. Try to summarize the conditions for each setup type that he lays out in the beginning of each chapter. Take note in the examples that he covers why it is sometimes okay to trade the less-than-ideal setups. There are many subtleties involved in reading the price action and Bob will explain these throughout the book so don't just skim over them. Those little clues he points out are very important in the determining what the direction of future price action is likely to be. Don't rely on the setups to tell you what direction to trade in. The setups should only be used to determine WHEN to enter.
When you are done with your first reading and taking notes, reread the book again. I didn't pick up on all the important points in the book on my first or second reading because I was too focused on the setups themselves. Read each example carefully. Try to write down the reasons that Bob gives for AND against taking a trade because this is what you'll have to do when trading. You will have to rationally defend your reasons for taking a particular trade if you want to be successful. Bob will reiterate many important points throughout the book so try your best to pick up on them.
Don't feel bad if you feel the need to reread the book several times more. I had to reread the book many times before I was ready to accept many of the points Bob tried to make because I wasn't ready to accept time until I had some trading under my belt. For example, Bob says on page 265 that the most important part of scalping is to understand the price action principles so that you can avoid the obvious bad trades. I didn't really "get" this point until this week and I've been trading live for almost two months now (I started reading the book in the middle of February). So don't feel discouraged if you feel confused. The learning process will take awhile but as you start to trade live (even on a micro account) you will start to understand more and more of what Bob is trying to teach you (I still have much to understand).
Or maybe I'm just a slow learner. :innocent: