Bob Volman Price Action Scalping

Hi all...

I was checking out Bob Volman's book, and I'm thinking about buying it but the one thing holding me back is the whole 70 tick chart requirement. I trade with Oanda and I can't get tick charts with them, MT4 and MT5 don't support tick charts either, though you can see the tick in line form in a small window that doesn't give you the candlestick formations.

Is it a useless strategy without the tick charts? Would be a shame to waste a lot of time studying it and then not being able to apply it, or having to invest in an expensive charting package/data feed.

Welcome to the thread.

If price action scalping seems like something you would like do then buying the book and spending the time to study it will not be a waste. The price action principles that Bob lays out is universal, thought his setups may be so. This has more to do with a charting platform's ability to display candles in 1 whole pip increments (no pipettes). It is possible to trade Bob's method on the 30 second chart in OANDA. It's less than ideal but that's okay when you are starting out. Once you start to get the confidence to trade regularly you can invest in a tick feed data/charting package.
 
Thanks! I guess the big advantage is that the tick becomes a proxy for volume which is such an issue in FX. I like the book and I think it pays to give it a read. I'm more of a 1H - 4H chart type of guy but there are times when the market simply doesn't give you anything there and it'd be good to build a scalping style as well.
 
BLS,

Thank you so much for your reply. I'm actually doing exactly what you suggested -- taking detailed notes from the book, making tables of those examples, and I plan to reread the book many times later.

Another thing I'm thinking about is how to do trading simulation. In MT4 you can only do M1 time charts (the lowest TF) with some simulator. Can you do it with tick chart in ProRealTime?

Yes. You can either use the paper trading module in ProRealTime or use MT4 to execute your demo trades. If you only have one monitor to trade off of, you can check out One Clicker. One Clicker is a separate program that lets you enter/exit with only one click. You can set it to be "always on top" so it'll always stay visible on your screen. The window is a bit big and you can't re-size it, so that may be a problem. I'm using it on two screens so I can hide the MT4 platform window. I just found out about it yesterday so I'm still testing it out.

http://www.softpedia.com/get/Others/Finances-Business/One-Clicker.shtml

Though I wouldn't worry too much about demo trading Bob's method just yet. The most important part of your learning process right now is getting those price action principles down. I will post the rest of Thursday's trade when I am done with today's session.
 
Last edited:
Rest of my trades from 7/19/2012 (Didn't trade on 7/20):

Charts are in GMT.

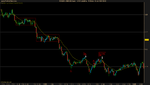
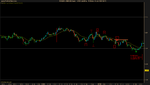
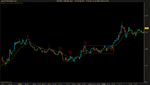
S1: Skipped DD setup. There seems to be some strong resistance at the 40 level with the bears trying three times to pierce the level (1). That pullback was more horizontal then diagonal. Though perhaps a more aggressive scalper could trade this given the strong trend.

E2: Failed DD setup. The with trend move and that 50% retracement are textbook. Prices pullback into former resistance area at (1) which coincided with the 20EMA. A setup like this isn't guaranteed to work out but the odds do favor it. Textbook setups can fail from time to time and this was one of those times. Oh well.

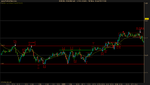
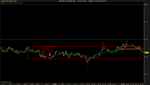
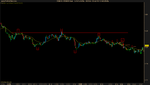
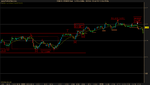
E3: Countertrend RB. After a strong down trend, prices swung violently and ranged around the 40 level. The bears have the advantage but the bulls aren't just going to take it. They manage to form a mini double bottom (1,2) as the bears try to push prices below the 40 level; the bears were doing a decent job too since they capped prices under the 20 EMA. From this base of support, the bulls gradually bring prices back up the 40 level. There's a lot contracts being exchanged here given the slow manner the prices came back up, which shows the bulls struggling. The bears whack the bulls back down at (3) in a strong move, but the bulls counter with an equally strong move, forming an equal high (4). The bears are eager to defend this level of resistance but sideline bulls come in a buy up at a higher price (5). Things are getting interesting.

One could draw their top barrier where the green line is given the amount of resistance there. The bears yet again sell off heavily at resistance (6), breaking that low of (5), but still printing a higher low overall. The pressure inside this range isn't too obvious. It looks like the bulls and bears are locked in a stalemate between swinging prices up and down, so we have to look for subtle clues to determine what the future direction of price action is likely to be. After being slammed down yet again (6), the bulls pushed their way through that heavy resistance (green line), perhaps surprising the bears. We can redraw the upper barrier after the high of (7) formed. The bears may have been surprised but they try to redeem themselves and bring prices below the broken resistance (dotted block, 8). The subsequent bullish response however shows us who's really in charge. With a false break to the downside, the bulls have made it clear that they are going to push prices even higher.

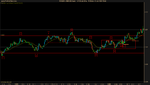
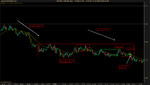
This is not the best of range breaks. My preferred stop would have been at the green line or even the low of (8) but that's an extra 3-5 pip for insurance. I forgo this insurance only to see my trade get stopped in a false counter move.

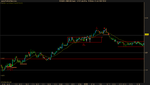
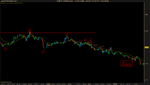
E4: I did not throw in the towel after that false break move stopped out my trade. That bullish response encouraged me to look for another way in the market. The bulls brought prices back to resistance (red segment), where we had some pre-breakout tension from those three dojis. This wasn't a good looking clustering ARB but was valid nonetheless. We have some hesitation after a range break, which forms some clustering and a signal line to trade the break of. I end up closing out 2 pip short of target after prices stall because I was really hungry and wanted to grab something to eat.
 

Attachments

  • Untitled picture.png
    Untitled picture.png
    14.5 KB · Views: 1,292
  • Untitled picture1.png
    Untitled picture1.png
    15.1 KB · Views: 1,061
Today's trades:

E1 & E2 (-5.7 + 8.7 = +3 pip): Took a couple of IRB setups. I got caught in a sneaky false counter move which stopped me out of my first position but I was ready to trade on the re-break. The range was pretty iffy as we don't have clear top and bottom barriers, though the top barrier I drew here was good enough. The overall pressure inside the range wasn't all too clear until the setup started to form. The chart starts off with the bulls retaking the 80 level after a downtrend (not on chart), with prices moving 20 pip (1 to 2). The bulls formed a base of support at the end of the pullback (3, a higher high) and drove prices even higher (4). They made a big mistake by trying to break the 1.2100 level after the bears started pushing back (5). This one directional move into resistance invited sideline bears to enter and slam the bulls back down, a typical false break. The bears assert their control, slowly squeezing the bulls (6), until they sell price back down past the 80 level, making a lower low (7).

I'd say that at this point the pressure inside the range is about even. A lot of contracts are exchanged within those dojis in the lows of (7), indicating that some bears are taking profit and some bulls are buying back in at lower prices. The pressure of the bulls brings prices back above the 80 level, printing a mini double top (8). With a visible resistance level inside the range, we can begin to draw a upper barrier for a possible IRB. Of course this upper barrier is only tentative and is used to give us a clearer picture of what is going on. The bears slam the bulls back down yet again but only manage to form a higher low (9); prices are quickly bought back up into the highs of (8). We may have a squeeze to the upside here. After two dojis, prices test the 20EMA and break out of the IRB setup on the next candle. I felt that this was sufficient buildup for a trade, though others may want more buildup. I remembered that Bob said that some aggression is required for IRBs because we seldom get a second chance on these. I placed my tipping point 4 pip below the barrier, right under that cluster before the break. I was stopped out but I re-entered because I was encouraged by the bullish response to the false counter move. I place my tipping point one pip lower to avoid another false counter move.

Price had trouble clearing the upper barrier of the bigger range but there was no technical reason to exit. I moved my tipping point up when prices dipped inside the IRB setup and shot back up. I ended up closing my position about 1.4 pip short of target because I was worried that the 00 level would ruin my trade and I did not want to risk my paper profits for 1.4 pip.


E3 (+7.3 pip): A nice horizontal pullback into the 20EMA after an uptrend formed this wonderful BB setup. Prices were moving rather fast in terms of ticks which spelled tension to me. I normally would be wary for setups like these after a break of the 00 level but given that cluster before the break and the seven touches forming the upper barrier, I felt it was worth taking a risk to get in on the break. I was so excited that I accidentally front-ran the break. I had my cursor on the "buy" button on my platform as I was waiting for the break. I was lucky this time and didn't get stopped out on a counter move. The bar after my entry (after the green arrow) was the first break and could have been skipped for more buildup, but then again a more aggressive trader could've taken it. There were two more opportunities (white arrows) to trade this BB as prices had trouble clearing the 20 level. I ended up closing my position about 2.7 pip short of target after prices seemed to have trouble break an earlier high (1). I might be forming a habit of closing out trades early for no technical reason but I did not want to take the risk of my trade souring on me for 2.8 pip. This might be a slippery slope but I'll try to find a balance between not forming a habit (and overestimating potential obstacles to the 10 pip target) and not risking current profit for an extra 1-2 pip. Prices may have hit my target on my platform.

Made 10.3 pip today.
 

Attachments

  • USD Spot.png
    USD Spot.png
    13.6 KB · Views: 1,014
  • USD Spot1.png
    USD Spot1.png
    13.1 KB · Views: 851
E1 (+8.5 pip): We had an extended 00 level fight for the past 2.5 hours before I took my trade. Things started to get interesting with that enthusiastic bull move from the low of (1) to the high of (2). The bulls had formed a base of support around (1) and tried to attack the 00 level fiercely. Price action around this time sped up compared to earlier. The bears weren't going to give in so easily so that slammed the bulls back into support (3), but the bulls were ready for it and quickly bought prices back up past the 00 level (4). Attacking to 00 level like that without much buildup left the bulls demoralized. Some bulls remained try to fight the inevitable as the bears pushed prices lowers. The bulls couldn't even test the 00 level to the pip anymore (5).

The bottom barrier is rough any way you try to draw it; it could've been drawn one pip lower. With my barrier drawn at the 1.2088 level, the bears were trapped in a tease break as they tried to break that level of support. But the bears capped prices under the 20EMA and formed a stalling candle. That spells ARB. I entered when the barrier was broken though I guess you could've have entered when that red signal candle was broken to the downside (enter on the barrier). There's some hesitation after the break as the bulls manage to test my tipping point before giving up this area. Prices dropped down around the 80 level where sideline bulls entered on lower prices and bears started to take profit. I closed my trade 1.5 pip early when I saw some support around the 80 level. I had a feeling that the 80 level would ruin my trade. Though I was right this time (my trade would've been ruined), I might be developing a habit of closing out early, which may lead me to overestimate the possible effects of resistance in the future.
 

Attachments

  • Untitled picture.png
    Untitled picture.png
    13.2 KB · Views: 831
E1 (-5.4 pip): Another 20 level fight. The bears tried to break the 20 level with a big move down (1) but these lower price levels were bought up by the bulls, all the way to the top of the barrier (2). Prices test the 20 EMA for a bit before the bulls brought them up again to test the upper barrier, eventually forming a squeeze. I took the break of the range but the bulls couldn't follow through. The bears capped prices at 1.2135 (3) and eventually took out my stop. I usually have a rule about not trading into the NY lunch hour because I've been burned many times before like this; I usually get screwed by low liquidity/volume which leads to less follow through on setups. I noticed in the past few days that there was more follow through around this time so I thought I'd give it a try. I'm not sure if I should just trade opportunities as I see them and not worry about volume/liquidity dropping off or if I should just avoid the second half of the NY session altogether.
 

Attachments

  • USD Spot.png
    USD Spot.png
    12.4 KB · Views: 874
Hi everyone!

I'd like to join your discussion. Unfortunately at this point I have more questions than experience to share and would appreciate your help.

Yesterday I was watching this range forming and it seemed to me there were some opportunities for the IRB trades. Do you see any technical reasons to skip these setups?

4ijv38.png


Thanks.
 
Last edited:
Hi everyone!

I'd like to join your discussion. Unfortunately at this point I have more questions than experience to share and would appreciate your help.

Yesterday I was watching this range forming and it seemed to me there were some opportunities for the IRB trades. Do you see any technical reasons to skip these setups?

4ijv38.png


Thanks.

I think it's usually better to let ranges like these, those that form between two 20-levels, set up a bit more before trying to trade them. If you take a look at Bob's examples in the book, the IRB setup usually takes quite awhile to form (relative to the start of a particular ranging formation). So it may have been too early to consider trading that first IRB. There also the matter of the immediate clustering to the left of the setup (right above the bottom barrier), which indicates strong support. Couple that with the scant buildup to the break of the IRB setup and I think this was a low odds setup. The barrier is likely to hold for awhile longer and it possible that your stop may be taken out.

As for the second and third setups, you are trading against the overall pressure, which is bearish. Just because the bottom barrier seems to be holding doesn't mean prices go up and test the upper barrier (unlikely but possible). Do you think the bears are going to bail when the setup break to the upside? What pain are they feeling that would become unbearable at the break of the setup? I can't think of anything. You also have to ask yourself where's the next level/area that give the bears a good chance to counter your long trade. I think that would be the the first "IRB" setup, which blocks your path to target. I think these reasons are enough to skip the second IRB setup.

As for the third one, you are trying to trade into resistance in the form of those double tops at the 1.2132 level. The bears capped the bulls two at this level. Take a look at the overall picture. The bulls are slowly getting squeezed. See how the bears shorted at lower and lower levels, creating those lower highs? The bulls didn't give up after that second double top when they kept prices one pip above the bottom barrier but that does not mean they are winning the fight. It's possible that the bulls may wriggle themselves out of this squeeze but I don't think that the third IRB setup you drew gave any indication that they would. All they could manage to do was print an equal high at the 1.2129 level, at which point they were quickly countered by the bears. This was where the double pressure occurred. The bulls tried one last time to bring prices up but when the bears quickly countered them, breaking the 1.2126 level, the bulls bailed which helped pushed prices down and out of the range. I don't think we could have traded this double pressure using Bob's method though.


No trades for me today. I had trouble sleeping last night and woke up later than usual which made me miss that crazy 160+ move that started at 10:00AM GMT. I was pretty sleepy/unfocused throughout my session so I probably missed some setups.
 

Attachments

  • USD Spot.png
    USD Spot.png
    15.4 KB · Views: 1,023
Thank you a lot BLS for such detailed explanation. I'm very grateful that you keep this thread going. Hope you will continue finding value in it. As a person with not much of practical experience using this methodology I've already found a lot of invaluable information here and will try to contribute in the future.
 
BLS,

Sorry for a rather technical question, the vertical scale on my prorealtime chart adjusts to the price, meaning if the price range gets smaller the size of the candles increases and visa versa. Could you please describe how you changed these settings and also how you made 20 levels highlighted.

Thank you.
 
Last edited:
BLS,

Sorry for a rather technical question, the vertical scale on my prorealtime chart adjusts to the price, meaning if the price range gets smaller the size of the candles increases and visa versa. Could you please describe how you changed these settings and also how you made 20 levels highlighted.

Thank you.

Right click on a chart and go to "chart settings". Set vertical scale density to low. Then click on the left side of the chart, the part with the prices, and drag up or down until you get the scale that you want.
 
Did you find a way to minimize the amount of with trend trades taken on false breakouts (in hindsight)? In this chart it looks like the level which was previously a resistance (1.2313) was successfully tested (though not to the tick) and the setup that followed (SB) didn't have any resistance on the way to the profit target.

1hu6o.jpg
[/IMG]

There wasn't much you could do about that false counter move. The closest stop beyond the tightest one was that low at 1.2313. You wouldn't consider giving the stop an extra pip or two because there is no corresponding low/high on the chart. I skipped this setup altogether because it was 10 minutes before the US GDP figures were to be release. That likely meant that many traders would wait for the numbers to come out before trading so you wouldn't get any follow through on the break anyway.
 
Thanks for your reply BLS. It seems the overall market dynamics, which sometimes depends on particular time of the day, is as important as determining the direction and entry points. Considering tight stops all the setups require pretty fast follow through, and I guess taking trades only in the most favorable conditions is one of the main difficulties.
 
Last edited:
E1 (+9.5 pip): Straightforward range break with a textbook squeeze. I closed my trade out early by 0.5 pip because my index finger was itchy. I think I'm developing a bad habit.

I broke a my rule for not trading while eating breakfast but I had to make an exception after seeing the overall pressure was favorable and seeing that textbook squeeze.

E2 (+10.1 pip): After my first trades, the bulls bought prices up all the way to the highs of (1). They did this without much buildup so that made it hard for them to keep prices above the 1.2300 level. The bulls tried to continue their trend but were slammed back at (1). The bulls tried to push prices up at lower levels but failed (2,3,4). The bulls managed to halt the slide in prices by forming a block ( I decided not to trade the break of it), which acted as a base of support. They used this base to bring prices back to the 00 level where they fought it out with the bears for control. This was a pretty textbook setup with the bears getting squeezed. There is some clustering to the left at (1) but giving the strength of the setup and how far that clustering is from my setup, I was not worried by it.
 

Attachments

  • USD Spot.png
    USD Spot.png
    13.2 KB · Views: 928
  • USD Spot1.png
    USD Spot1.png
    13.7 KB · Views: 960
E1 (+0.5 pip): The chart starts off with some downward pressure after the bulls failed to break past the 90 level, followed by an attempt to retake the 80 (1). We get a hint of a possible range formation when the slide in price is halted by the bulls right above the 60 level. This is a typical range fight, right between two 20-levels, with a false break on each side (3 and 4). The pressure is slightly in favor of the bears but it's too early to take any trades. Things start to get interesting when the bears printed a lower high (5) and tested the 60. The subsequent bullish response (blue bar, 6) gave us a bottom to connect with the lows of (2) to draw a bottom barrier. It's rough but it'll work until price shows us otherwise. There's still some bullish hope left as the bulls make a higher high (7) that pierces the 20 EMA but the bears are ready and waiting to sell heavily until prices break the bottom barrier. We've got a some buildup and a nice squeeze and I take a short at the break of the barrier.

My entry slips by a pip or so and I don't get much follow through on the break. I begin to trail my stop aggressively because it appears that support around the 60 level maybe stronger than I have anticipated. I move my tipping point down the lower barrier of the range when prices tested the 60 level (8) and dropped to the 53 level. Prices start to go sideways and I figure that if prices can't move on then that will increase the odds that I will stopped out in a counter move so I trail my stop 3 pip lower. I got nervous and bailed out one pip early of newest stop. I need to work on trade management because this latest stop was too aggressive. I probably should've moved the tipping point to the 60 level, where prices tested it successfully and tried to move on (8).
 

Attachments

  • USD Spot.png
    USD Spot.png
    12.7 KB · Views: 791
  • USD Spot1.png
    USD Spot1.png
    12.8 KB · Views: 791
E2: After a lengthy down move prices printed a reverse head and shoulders formation (1,2,3). This would give the bulls an excellent chance to reverse the down slide but the bears capped prices at the highs of (4) and slammed prices back down. The bulls look like that might be in for a squeeze as they fail to buy prices back up above the 40 level (6). The bulls didn't give in a used the double bottom (5, 7) as a base of support to fight back. Prices stall out at the highs of (8), allowing us to draw a barrier. That test of the 40 area (9) was a very welcome sign as it made it more likely for prices to move on up. Prices break out of the range barrier too quickly for me to trade but a ARB setup of the clustering variety formed right above the barrier.

Prices jumped up 3 pip so my entry ends up slipping by 1-2 pip (tried to enter on 53 but filled at 55). The trade was rather healthy for the most part but the bulls had trouble clearing the 60 area. I decided to bail 3 pip short of target after prices could not follow through on the break of a previous high. Had I gotten filled at my desired entry I probably would have made target. The trade eventually sours.


I'm sorry if my analysis doesn't seem to be as detailed as my other posts. I'm feeling a bit lazy today. :innocent:
 

Attachments

  • USD Spot.png
    USD Spot.png
    13.8 KB · Views: 725
  • USD Spot1.png
    USD Spot1.png
    14.2 KB · Views: 725
Top