You are using an out of date browser. It may not display this or other websites correctly.
You should upgrade or use an alternative browser.
You should upgrade or use an alternative browser.
BLS
Established member
- Messages
- 642
- Likes
- 229
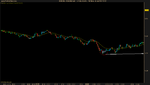
Does anyone have experience trading with-trend setups close to the round numbers? Would you say the first pullback after the break is a bit too risky to trade?

Thanks.
No. That trade looked fine me, might have required some aggression to trade given that small sideways action. I missed it myself because I was too happy catching that break of the round number zone moments earlier (bad!). It may or may not have hit target depending on your platform. There seems to be strong resistance around the 20 level that, while unfortunate, was unforeseen and should not factor into your hindsight analysis of the trade (unless there was something before the DD break that indicated there would be resistance blocking our target).
I'm aware of your earlier question but I don't have the time right now to scroll back my charts to find that particular setup.
Thank you BLS. Hope you will find some time to share your today's trades. Particularly I'm very interested how you played the move which led to the break of 1.23 level. I noticed that buying pressure was clearly building up just under the level but didn't see a setup there.
Last edited:

virtuesoft
Member
- Messages
- 94
- Likes
- 2
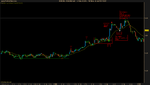
I just took this Second Break setup. It didn't work out this time and I suffered a loss of 7.8 pips.

Last edited:
virtuesoft
Member
- Messages
- 94
- Likes
- 2
Does anyone have experience trading with-trend setups close to the round numbers? Would you say the first pullback after the break is a bit too risky to trade (DD in the chart below)?
Thanks.
I took that same setup. I decided to exit around the break even level because the price dropped strongly below the 20ema. I don't have any regrets over the trade. I think it was a valid setup.
virtuesoft
Member
- Messages
- 94
- Likes
- 2
My main focus is EURUSD but I also watch GBPUSD, AUDUSD and USDJPY as some good setups sometimes form on these pairs too.
I took this Range Break setup in GBPUSD earlier today which resulted in a 10 pip profit.

I took this Range Break setup in GBPUSD earlier today which resulted in a 10 pip profit.
I just took this Second Break setup. It didn't work out this time and I suffered a loss of 7.8 pips.
Hi virtuesoft,
Thanks for your comment. Regarding the SB setup you took, I've noticed that breakouts like (1), where price retraces back into the resistance zone of previous high (2), have a higher chance of being fake ones. Not only there is additional resistance to break on the way to the target, but generally breakouts without proper buildup tend to fail more often than not.

virtuesoft
Member
- Messages
- 94
- Likes
- 2
Hi Vanica,
Thanks for your reply. I see what you mean about it straying back in to the resistance zone of the previous high. I'll add this to my notes and look out for it in the future.
Thanks for your reply. I see what you mean about it straying back in to the resistance zone of the previous high. I'll add this to my notes and look out for it in the future.
BLS
Established member
- Messages
- 642
- Likes
- 229
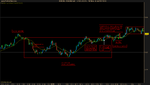
Is there anything wrong with the shape of the pullback in this DD setup?
[/IMG]
Would appreciate any comments!
Too much clustering above a even number zone (1.226) for my liking; meaning there is possible support down below, though at the time it was hard to assess whether you would be shorting into support or not. Couple that with a horizontal pullback and this DD setup would look rather shady. It's hard to explain, perhaps I am looking at this a bit subjectively.
Attachments
TonyIommich
Member
- Messages
- 79
- Likes
- 21
After some experimenting I decided to write to Bob about the tick chart situation, and he was good enough to respond. Basically Bob made the following points:
1. 30 second charts are probably close enough to the 70 tick to trade effectively, though he prefers the 70 tick.
2. The bigger problem with the free brokerage feeds is the issue of pipettes. If you have pipettes, you can't accurately see signals because the closes don't line up neatly.
I found that over the span of 1 hour during the liquid NY session (from around 10 to 11 am EST), the 30 second chart produced 120 candles, while the 70 tick ProRealTime produced 100 candles. The moving averages look very similar.
I also tried an Oanda MT4 20 tick chart based on the mods I described earlier, and got 67 candles during that same interval, which is 33% fewer bars than the 70 tick ProRealTime. Moving average is also similar despite the lower resolution.
Unfortunately I noticed there was quite a bit of variance with the MT4 mod, at certain points in the trading session the 70 tick ProRealTime and the 20 tick MT4 were practically 1:1 perfect with each other, with the 20 tick producing slightly more bars than the 70. Then the 20 tick ended up lagging as indicated above. Whether this is due to bad live data from Oanda or whatnot, I can't say.
The pipette issue is not resolvable in MT4. What I was able to do in Oanda's web trader interface was to disable pipettes, but that will not make the candles align to the pip. It makes the price quotes omit pipettes and puts a full pip magnet to the take profit and stop order lines. I always show the bid and ask lines of my orders which is a full pip in width, that helps me see the full pip width and makes sure I'm aware of how volatile the market is currently trading.
Anyway, I'll see if I can find any other way of keeping my costs down as I'm learning this system.
Does anybody have any suggestions on how they approached this book? Do you keep it as a reference when you trade? Do you regularly re-read the chapters? Is it better to read the whole thing once through and then selectively re-read? Just looking for some suggestions.
Apologies for being absent in writing. I've been wrangling with Bob's method recently and have come to the following conclusions.
There are trade set ups that exist in each session, however for me, I have a compulsion to trade and there are perhaps not as many text book set ups as a 'scalping' method / 30 second type chart would lead you to believe.
From a newbie's perspective, there's 1-2 set ups per Ldn and 1-2 set ups per NY session. Naturally Bob may spot more, but that's a general rule of thumb I've found on just EUR/USD.
The screen time involved for 2-4 trades is quite extensive and difficult to keep focus, however when the set ups occur, they are spot on. Full credit to you Bob.
Bob has explained to me (via e-mail) to act like a pilot, it's all about the landing and taking off and not to be trigger happy and do loop the loops mid flight.
It's a tough ask, but I'm working on my discipline.
I keep Bob's book to hand and have printed out a 'typical' chart of each set up that I keep by my desk.
Bob has mentioned that the markets are tricky at the moment and times were better at the time of writing the book. Specifically the volume and therefore the follow through isn't always there, so to choose your set ups wisely. Be a pilot.
After some experimenting I decided to write to Bob about the tick chart situation, and he was good enough to respond. Basically Bob made the following points:
1. 30 second charts are probably close enough to the 70 tick to trade effectively, though he prefers the 70 tick.
2. The bigger problem with the free brokerage feeds is the issue of pipettes. If you have pipettes, you can't accurately see signals because the closes don't line up neatly.
I found that over the span of 1 hour during the liquid NY session (from around 10 to 11 am EST), the 30 second chart produced 120 candles, while the 70 tick ProRealTime produced 100 candles. The moving averages look very similar.
I also tried an Oanda MT4 20 tick chart based on the mods I described earlier, and got 67 candles during that same interval, which is 33% fewer bars than the 70 tick ProRealTime. Moving average is also similar despite the lower resolution.
Unfortunately I noticed there was quite a bit of variance with the MT4 mod, at certain points in the trading session the 70 tick ProRealTime and the 20 tick MT4 were practically 1:1 perfect with each other, with the 20 tick producing slightly more bars than the 70. Then the 20 tick ended up lagging as indicated above. Whether this is due to bad live data from Oanda or whatnot, I can't say.
The pipette issue is not resolvable in MT4. What I was able to do in Oanda's web trader interface was to disable pipettes, but that will not make the candles align to the pip. It makes the price quotes omit pipettes and puts a full pip magnet to the take profit and stop order lines. I always show the bid and ask lines of my orders which is a full pip in width, that helps me see the full pip width and makes sure I'm aware of how volatile the market is currently trading.
Anyway, I'll see if I can find any other way of keeping my costs down as I'm learning this system.
Does anybody have any suggestions on how they approached this book? Do you keep it as a reference when you trade? Do you regularly re-read the chapters? Is it better to read the whole thing once through and then selectively re-read? Just looking for some suggestions.
I think you can spend forever reading and reading again the book and just not get down to business. It's a great book and for me, I read it twice, went to put it in practice and then for each of the set ups I trade in real time (micro lots), I tried to find a similar chart example from the book. Sometimes I'd find that I traded something in my head and nothing like Bob's set up! It's good to review your trades against your plan aka Bob's book and that way you'll be able to hear yourself talk through set ups like him. If you read BLS's posts on trade reviews that's what we need to aim for, as if I hadn't spoken to BLS on Skype then I'd think it was Bob!
BLS
Established member
- Messages
- 642
- Likes
- 229
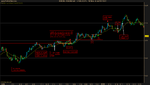
E1 (+10.5 pip): Bullish pressure on this chart starts off with the bulls nudging prices up, first by printing a higher low (1), and then a higher high (2). It's very subtle but the bulls have retaken the 80 level after bears had capped prices under the 80 for a good chunk of time. Prices find resistance at the high of (3) with some bears trying to short at more favorable levels. Prices pullback to the 20 EMA and continue on. The bulls find some resistance under the 1.2300 level and a block forms. The bears are shorting at the 97/98 levels but the bulls keep buying at higher and higher levels, keeping prices above the 20EMA. There's going to be some double pressure; either the bears bail and prices break to the upside or the bulls fumble and prices remain (or perhaps fall) under the 00 level. Given that prices haven't really touched the 00 level in the past 2-3 hours (haven't been ranging around it or haven't dropped down below it a downtrend), a vacuum effect is likely to occur. Couple that with that bullish bar at my point of entry and I'm ready to take the break of this BB setup. This trade was a bit aggressive but since a vacuum effect seemed likely this was a high odds trade. The top barrier of the block could arguably have been drawn one pip lower and one could have entered earlier though I would find that really aggressive. That bullish bar at my point of entry served as better confirmation for a break of the 00 level.
E2 (-5.2 pip): I should have skipped this ARB trade because the technical stopped required was larger than my 10 pip stop loss. The tipping point I ended up using was pretty bad.
E3 (+10 pip): Nice BB setup. The bulls take control of the 00 area but face some stiff resistance from the bears. Indeed the first half of the block looks like the bulls are getting pushed back, but the bulls cleverly buy up prices 1 pip about the 00 level. This is a very bullish sign since prices are more likely to move up if they first test former resistance. Then we get some classic pre-breakout tension in the form of two tiny dojis (the barrier could have been drawn one pip lower but I didn't want to risk it). The lows of those two dojis rest neatly on an earlier high, giving my a perfect spot for my tipping point. The bulls then proceed to attack the 20 level but only break it by one pip. That was enough for my trade to hit target, though just barely.
Attachments
TonyIommich
Member
- Messages
- 79
- Likes
- 21
Thank you for the suggestions, I totally agree that its easy to do too much research and not enough action sometimes! A balance of both is needed I think.
Yes, I'd venture to guess that when the vix is higher, you probably get more punch. Also, summer markets are usually pretty tough to trade.
I know of another scalper who trades EUR/USD on his own using 5 and 1 minute charts. He does 5 pip take profits and 5 pip SLs with a 1 pip spread, slight negative risk reward when you figure spread and slippage. But it seems rather common for short term traders to explore negative risk reward setups, the trick is to be very accurate which of course is tough. Boris Schlossberg uses such setups with fundamentals and Al Brooks off technicals (his 'scalp' setups).
Bob has mentioned that the markets are tricky at the moment and times were better at the time of writing the book. Specifically the volume and therefore the follow through isn't always there, so to choose your set ups wisely. Be a pilot.
Yes, I'd venture to guess that when the vix is higher, you probably get more punch. Also, summer markets are usually pretty tough to trade.
I know of another scalper who trades EUR/USD on his own using 5 and 1 minute charts. He does 5 pip take profits and 5 pip SLs with a 1 pip spread, slight negative risk reward when you figure spread and slippage. But it seems rather common for short term traders to explore negative risk reward setups, the trick is to be very accurate which of course is tough. Boris Schlossberg uses such setups with fundamentals and Al Brooks off technicals (his 'scalp' setups).
BLS
Established member
- Messages
- 642
- Likes
- 229
Does anybody have any suggestions on how they approached this book? Do you keep it as a reference when you trade? Do you regularly re-read the chapters? Is it better to read the whole thing once through and then selectively re-read? Just looking for some suggestions.
On your first reading, take notes of the general guidelines of each setup type and take notes on important points that he likes to repeat (not a bad thing by far since it took me awhile to get it) like "Always ask yourself if somewhere on the path to the 10 pip target there is a level that needs to be surpassed that offers your opponents excellent odds to counter your position."
Then reread the book again before you even think about demo trading. You can selectively reread sections of the book if you seem to have problems with certain setups or you could reread the entire book again when you have free time. Sometimes it takes some demo/live trading before you are ready to accept even the most basic points like having to constantly focusing on price action rather than just waiting for setups to appear while watching YouTube videos (I was guilty of this).
You should keep the book at your side as a reference when trading but don't use it as a crutch. You are to first and foremost assess overall price action and to apply some logic when determining which direction to trade in and when to trade. Using the charts from the book is a useful reference at times, such as when pondering counter trend range breaks (11.6 and 11.9), but there will be other times when a setup is valid but the overall conditions don't resemble anything from the examples; there many ways a setup can present itself and despite Bob's numerous examples in the book, it is unlikely that he got all of the different varieties. That is when you have to apply price action principles to determine if 1) The overall pressure is supports your trade, 2) There are no unfavorable conditions, and then finally 3) The setup is valid. But you won't really know when you absolutely need to do this so that means you have to constantly force yourself to judge price action in its current light to keep yourself focused.
Nice to discover this thread. I've been trading Volman price action setups for a couple months, mostly DD, SB, BB, and IRB. I scalp index and currency futures, not forex.
One recurring issue I have is that I see reversals everywhere, even when they don't turn out to be reversals. I know Bob says to treat all pullbacks like pullbacks, but I still tend to read reversal more than I should. Especially at micro double-bottoms and strong countertrend bars bars.
I wonder if you all would share how you handle this. What technical criteria constitutes a reversal for you? What signals you to start considering entry in the opposite direction?
Thanks. I'll be glad to post some trade examples with charts in the future.
John
BLS
Established member
- Messages
- 642
- Likes
- 229
Nice to discover this thread. I've been trading Volman price action setups for a couple months, mostly DD, SB, BB, and IRB. I scalp index and currency futures, not forex.
One recurring issue I have is that I see reversals everywhere, even when they don't turn out to be reversals. I know Bob says to treat all pullbacks like pullbacks, but I still tend to read reversal more than I should. Especially at micro double-bottoms and strong countertrend bars bars.
I wonder if you all would share how you handle this. What technical criteria constitutes a reversal for you? What signals you to start considering entry in the opposite direction?
Thanks. I'll be glad to post some trade examples with charts in the future.
John
Hi John, welcome to the thread. I only trade reversals with range breaks. I want to see a convincing reversal pattern followed by sufficient fighting between the bulls and the bears. Prime examples of counter trend trades are 11.6 and 11.9 from Volman's book. You can trade counter trend with BB's too (10.7) but I'm not too comfortable with those.
TonyIommich
Member
- Messages
- 79
- Likes
- 21
You should keep the book at your side as a reference when trading but don't use it as a crutch. You are to first and foremost assess overall price action and to apply some logic when determining which direction to trade in and when to trade. Using the charts from the book is a useful reference at times, such as when pondering counter trend range breaks (11.6 and 11.9), but there will be other times when a setup is valid but the overall conditions don't resemble anything from the examples; there many ways a setup can present itself and despite Bob's numerous examples in the book, it is unlikely that he got all of the different varieties.
Thanks BLS! What I like about Bob's approach is that it has enough parameters for definition, yet at the same time room for discretion. Its a fine balance between discretionary and rules based trading. After working with Bob's book I'm also intending to study Al Brooks and try to merge the approaches together.
As I can see here, somebody has already been using Bob's approach with index futures, and that is another market I want to tackle in due time.
Similar threads
- Replies
- 15
- Views
- 9K