BLS
Established member
- Messages
- 642
- Likes
- 229
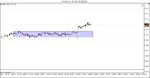
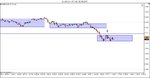
Week 2 2016 charts from Volman:
https://www.dropbox.com/sh/1amxmi9af0fk6ej/VA5_ZrjQF1
https://www.dropbox.com/sh/1amxmi9af0fk6ej/VA5_ZrjQF1
My opinion is that you will be much better off trading his first book. You bought the wrong book maybe you can cancel and change to the 1st book. or just refuse delivery and send it back for the 1st book. you will be fine with 70 tick bars. they look just like any other bar. you can use candlestick bars of 70 tick bars. I have both books and only the 1st one is really tradable. that is why no one talks about book 2. it is not really tradable. It never gives any trades. forget it.
Just my opinion. Your opinion may vary.
Ninja Trader is free and will do the bars for you if TradingView does not do tick bars. Ninja Trader 8 is due out any moment now. it was suppose to be out the first 2 weeks of January. so it is now a little late. it may even be available now.
Hi! thank you for your reply. Well, I just bought the other one called "Forex Price Action Scalping: an in-depth look into the field of professional scalping."
So, I will read both of them. how about that? 😀
I have one more question =) I´m watching through bob´s charts of the last 3 weeks and noticed that he took about 45 profitable trades. It´s just amazing! So my question is. Does anyone do nearly as good as bob does? I See that BLS is here from the beginning and I´m very interested how u are doing? How many trades do u have per week? How many of them are profitable? Sorry if I´m too personal, just very curious and trying to get some motivation to study the charts haha.
Cheers
Andy
The issue Andy is that Bob does not really have a totally stand alone trading system per se, rather they are ideas that once you've tested them can be a backbone to your own trading system. The charts he posts are merely his view on the market given his technical guidelines that do, by the way, evolve if you look at all the charts. Also, keep in mind he does not say "I took this trade", he just offers you his analysis. It may be very well that he took those trades, and also took some that he did not mark on the chart.
I find Bob's ideas to lead to profitable trading setups that work for me (I trade stock indeces), but I also combine his ideas with some other concepts that work together well. The more you study technical trading the more you realize the ideas are fairly similar, it is simply a matter of applying them in a way that works with the given market environment, the use (or not) of certain tools of analysis, and your own personality. So even if I told you that I make X per month or year trading Bob's ideas, it's not accurate because you could never reproduce what I do 1:1, just like you can't reproduce exactly what Bob does.
If this was a system that could be entirely quantified and programmed, it would be a different matter. Even then, you could adjust it any number of ways and achieve different performance depending on market conditions.
My suggestion is to study Bob's concepts and then build your own method around his ideas based on your extensive research of many, many, many charts (and Bob's charts will be a help to develop your eye). As Bob says, you have to make this methodology your own, and that can only be achieved by repeated study of the charts of the market and time frame you trade as well as re-reading the book. I also suggest you get his second book, it works upon similar themes but introduces some more ideas.
In the end if you're a discretionary trader you end up developing your own style, the key is you know that it works by having done lots of market study and traded it live in current market conditions.
On the other hand you may get some more opportunities every day and this is what makes scalping very attractive to me. So I just have to study the charts and test the ideas on a small account. I already read his second book, but I like the first much more. It´s more detailed and I start to like the tick-charts, because they aren´t based on time but ruther on volume.
When you study the charts you'll get a good feel for how many opportunities come up, but as with anything there will be some high and dry times, esp. in the FX market. You have to ask yourself if its worth it to spend all that time in front of the screen because there will be cases where you may be lucky to get one good setup a day (and that is the entire span of the session which Bob trades on the tick, from the EUR open to the NY close).
Somewhere back in this thread I did a tabulation of how many opportunities a day Bob had on his 5 minute setups in EUR/USD based off his second book's charts, and someone else (toward the very beginning of this thread) did a calculation of how many setups Bob had on average in his initial chart postings off the 70 tick. It seems that much of the time, the meat happens in the European open and first few hrs thereafter with FX.
So whatever time zone you are located in you will have the best success most likely if you trade that time period, esp. with the 5 minute setups (you get a bit over 1 conservative setup a day on average, but if you just traded the NY-European overlap session off the 5 minute you got like 1 setup a week). This is especially the case during quiet markets.
Otherwise you may want to look into adapting the method to stock indexes (be it futures, etfs, options, cfds, etc). That is what I ended up doing because I just find that FX is really not that jumpy as when I started looking at it in 2009. Bob's method works particularly nicely with setting up breakouts or reversal IRB type trades in the PM session, with the AM session the market tends to make more angular moves that are tougher to trade using Bob's pattern breakout method, although if you use overnight data (which I highly suggest when using Bob's method) it can provide some great ideas there too.
Regarding tick charts, I am a big fan of them when markets are volatile, like around the open and close. But they are not strictly necessary, you can just switch to a faster time frame during the more volatile hrs and then pop to a higher time frame when things slow down (e.g. 1 minute and 3 minute, or whatever works for you).
Anyway, good luck!
What I didn´t like on the 5-minutes chart was, that if my first trade was good, so I felt good, but if the first trade was a loser, so often it was hard to cover the loss at the same day. I think I have more chances to do it on 70-tick chart. Thanks again for your help!
I would argue that regardless what chart you trade, you should never think in terms of 'profitable for the day' because that is the road to problems. I know, I've been there myself. The big problem with day trading is that there is a big risk of over-trading and if you're not used to that, smaller time frames can be an invitation to problems. The best time to make money is in the most liquid hours, and as time moves on in the session the chances of a good move decrease, yet if you're upset over a loser earlier your judgement becomes more impaired and you feel an urge to trade.
The only traders IMHO who can look at their daily performance seriously are those who have strategies that offer 10 setups a day or more (super-scalper types).
Also, you need to consider that with a smaller chart, your targets are smaller and thus your commissions will eat more into your bottom line. This does add up to some serious coin if you do the math.