Bob Volman Price Action Scalping

was this an example of what bob was saying in his book? that price action will show me that there might be news upcoming? or was it just coincidence? cause i'm still not sure if my decision to stay out of the market yesterday was a good idea cause i saw many people traded

Yes, the market was pretty comatose yesterday waiting for the FOMC announcement at 2:00 EDT. You should check an economic calender, such as at Forex Factory, before you trade everyday.

While the market action was slow, sometimes there are still tradeable opportunities. You just have to be extra selective, knowing that volume and volatility is going to be severely reduced.
 
Yesterday’s FOMC aftermath had US bulls back out in force, with a rapid drop from just over 1.3400 to under 1.3300. I felt that erring on the short side today was probably going to be the smart way to deal with things.

1 miss 1 – I missed this block break. Only saw it about two bars afterwards. I’m not even really sure why I didn’t see it. I was waiting for price to test up around the 1.3270 level and I think it just wasn’t close enough to that level for me to consciously register it yet. Even though it forms a nice triple top, with the block allowing for a nice entry point and small tipping point stop loss. This was the best setup of the day and I fluffed it.

Price then went on a tear, forming a spike down from 2 to 3. After that channel formed from 4 to 9. A classic spike and channel formation for the Al Brooks devotees.

5skip 1 – After the strong move down I was waiting for a decent countertrend move to form before looking for a potential short signal. I saw this block forming at 5. The block looked nice but price hadn’t retraced enough for me to consider a short just yet so I passed.

8skip 2 – I could see a ragged support level forming at around the 1.3209 level. There wasn’t enough pre-breakout tension at 6 to take a straight RB so I waited. At 7 price pulled back into the range and I saw an ARB setup form. But my doubts around the ragged support level stayed my hand.

Afterwards I felt weird that I hadn’t taken either of the two skipped trades. It almost felt like I had been scared to pull the trigger, although I’ve never been one to suffer from that affliction. I just couldn’t pin down why I didn’t take either signal. On another day I most certainly would have. In the end I think the best way I can describe it is that I just didn’t feel in touch with the market today. On some days I feel intricately linked, like I’m taking the pulse of the market. Today was the opposite. I felt detached and didn’t have a good have a good handle on things, even though the market was clearly trending south.

On the plus side, I stayed my hand and didn’t take any poor entries just for some action.
 

Attachments

  • EURUSD_20062013.png
    EURUSD_20062013.png
    57.1 KB · Views: 169
  • EURUSD_20062013b.png
    EURUSD_20062013b.png
    56.9 KB · Views: 271
Some opportunities today that I failed to take, but it's okay... my faith in the power of the Mms and Wws has been restored. It's just a matter of detecting them when they present themselves with unclear barriers.

I took 3 trades today, none of which hit target.

The first one was invalid: the DD I took was a textbook setup BUT it wasn't in accordance with the overall conditions. I recognized that immediately but then again that trade was taken more for emotional reasons: prices were finally moving after a 3 day freeze and I thought to myself 'why the hell not' -> this never leads to good trades btw.

The third chart is probably the best opportunity today but I didn't take it cos of weird PRT candle printing.

The second trade seemed valid to me but the entry I picked didn't allow for the target to be reached.

The last trade seems valid as well, but follow through was insufficient and the TPT got taken out.
 

Attachments

  • 4 - Thursday.png
    4 - Thursday.png
    29 KB · Views: 260
  • 5 - Thursday.png
    5 - Thursday.png
    31.3 KB · Views: 695
  • 6 - Thursday.png
    6 - Thursday.png
    30.7 KB · Views: 223
  • 7 - Thursday.png
    7 - Thursday.png
    32.8 KB · Views: 213
  • 8 - Thursday.png
    8 - Thursday.png
    27.5 KB · Views: 237
  • 12 - Thursday.png
    12 - Thursday.png
    30.7 KB · Views: 172
  • 11 - Thursday.png
    11 - Thursday.png
    33.8 KB · Views: 239
  • 10 - Thursday.png
    10 - Thursday.png
    29.8 KB · Views: 157
  • 9 - Thursday.png
    9 - Thursday.png
    28.5 KB · Views: 144
  • 13 - Thursday.png
    13 - Thursday.png
    29.6 KB · Views: 176
The last trade seems valid as well, but follow through was insufficient and the TPT got taken out.

A personal observation of mine:
Basically price moves up to try to break the 20 level one direction, fails, builds up somewhat to break in the other direction in the form of an RB. That 20 level break fails as well.

I haven't nailed down the specifics but it's something I'm become wary of.
 

Attachments

  • Untitled picture4.png
    Untitled picture4.png
    30.2 KB · Views: 214
  • Untitled picture3.png
    Untitled picture3.png
    25.1 KB · Views: 216
  • Untitled picture2.png
    Untitled picture2.png
    24.1 KB · Views: 168
  • Untitled picture1.png
    Untitled picture1.png
    20.6 KB · Views: 166
  • Untitled picture.png
    Untitled picture.png
    20.3 KB · Views: 213
  • Untitled picture8.png
    Untitled picture8.png
    25.1 KB · Views: 213
  • Untitled picture7.png
    Untitled picture7.png
    22 KB · Views: 336
  • Untitled picture6.png
    Untitled picture6.png
    21.8 KB · Views: 319
  • Untitled picture5.png
    Untitled picture5.png
    24.5 KB · Views: 149
The London session started out in a 5 pip range. There was a long false break (1) before a fully fledged breakout to the south (2).

3trade 1 – After a 30 pip bear trend there was a nice orderly pullback. This entry was a FB.

4trade 2 – When the FB didn’t work out I was on the lookout for a second break entry. This entry was where I got back in short for the SB.

Both the FB and SB entries got stopped out. It looked like price was going to retrace all of the breakout move, which it duly did.

5trade 3 – Since price never managed to break back into the range that had started things off at 3:00 I was still more inclined to look for shorts than longs. A range then started to develop with the support level at 1.3219. Again, there was no follow through when I entered after seeing 5 bars with lows right on the support level.

For the rest of the session price just meandered around the 1.3220 level.

Questions as a result of today’s trades that I need to ponder: was it worth entering on both a FB and SB? Should I have just picked one or the other?
 

Attachments

  • EURUSD_21062013.png
    EURUSD_21062013.png
    56.9 KB · Views: 1,342
The London session started out in a 5 pip range. There was a long false break (1) before a fully fledged breakout to the south (2).

3trade 1 – After a 30 pip bear trend there was a nice orderly pullback. This entry was a FB.

4trade 2 – When the FB didn’t work out I was on the lookout for a second break entry. This entry was where I got back in short for the SB.

Both the FB and SB entries got stopped out. It looked like price was going to retrace all of the breakout move, which it duly did.

5trade 3 – Since price never managed to break back into the range that had started things off at 3:00 I was still more inclined to look for shorts than longs. A range then started to develop with the support level at 1.3219. Again, there was no follow through when I entered after seeing 5 bars with lows right on the support level.

For the rest of the session price just meandered around the 1.3220 level.

Questions as a result of today’s trades that I need to ponder: was it worth entering on both a FB and SB? Should I have just picked one or the other?

I would have passed on the FB because the move down was not the initial move down but rather a continuation from the 1.323 BB. FB's are reserved for initial moves only.

I would have passed on the SB because its high was higher than the FB high making the trend up.

As for the third trade I think the logical (obvious to others) TP should have been at the upper barrier of the box making it a high risk proposition. I agree with your bearish disposition on the market at that point in time and would be very tempted to take that trade but only as a very low risk gamble with the stop one pip above the 1.322 level. With the odds of that 20 level being retested being very high the trade would have a low probability of success and would best be skipped.
 
HornedGod : I think you're trading setups that would've been fine if the market was behaving the same exact way as it was at the time the book was written (2011). Your trades seem valid in regards to what is presented in the book, but these days they don't work out well. You should check out the charts Bob has been sending us if you haven't done so already. He doesn't take many continuation setups (SBs, FBs, DDs or even small continuation blocks) these days.

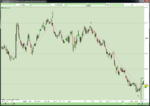
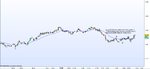
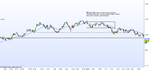
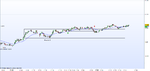
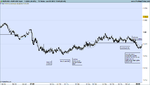
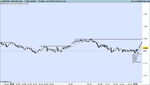
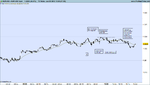
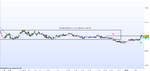
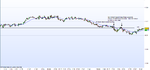
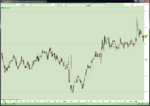
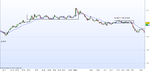
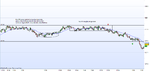
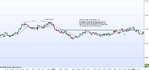
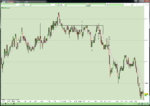
I myself took two trades yesterday none of which worked out. Kind of unlucky considering the fact that these were pretty solid Mms/Wws, so I started doubting myself again.

Then I rechecked all of my trades going back 9 weeks and regrouped all of the more obvious Mm/Ww patterns (a lot of which I didn't take at the time, but now I think I am starting to gain experience to recognize these). Anyhow, what I found out was that over the course of the last 9 weeks, if I had taken those obvious Mms/Wws, it would have produced a net of 130 pips. This is approximately 25 pips per week which isn't bad considering you're basically trading only the most textbook setups. Of course one has to actually trade them, which I didn't do at the time but I am hoping this will come with experience. One also has to NOT trade some of the more inferior setups which is much more detrimental than skipping setups. All in all this small statistical analysis reinforced my confidence in the method.

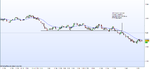
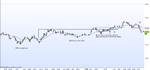
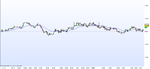
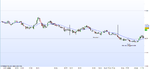
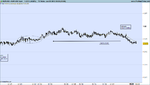
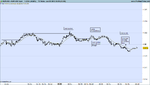
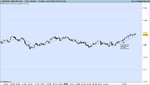
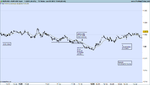
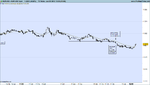
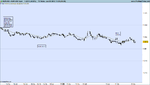
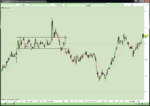
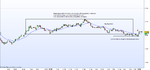
Here are my charts from yesterday, the trades being chart 1 and 4.
 

Attachments

  • 18 - Friday.png
    18 - Friday.png
    28.2 KB · Views: 233
  • 17 - Friday.png
    17 - Friday.png
    27.9 KB · Views: 228
  • 16 - Friday.png
    16 - Friday.png
    31.9 KB · Views: 184
  • 15 - Friday.png
    15 - Friday.png
    32.6 KB · Views: 321
  • 14 - Friday.png
    14 - Friday.png
    28.6 KB · Views: 170
In weeks like these I especially stare at Bob's technical skill with awe. He just breathes the market.

Great charts.
 
1trade 1 – The 2:00 EDT hour just saw a continuation of the range trading that had been unfolding since the start of the week. Right at the start of the London session there was build-up at the support level. It was enough for me to put on a short trade when the support level broke.

When the four dojis at 2 were printing I was prepared to take a short DD position if price broke down.

3trade 2 – This was a nice block right at the resistance level from the earlier range. Entered long and while price did move 10 pips on the chart here, it didn’t move far enough to reach my TP. I still needed it to move another pip or two to cover my spread on the trade. My first tipping point for this trade was the support at 4. When a new higher low was printed (5) I moved it up. Was I too quick in moving my tipping point up? I wonder as obviously if I had left it at the 4 level my trade would have reached its TP when price spiked up (6) on the German Ifo Business Climate data release at 4:00 EDT.

The only other potentially tradeable opportunity was an ARB at 7 out of the range defined before the Ifo release. I didn’t like its chances due to the block (3) that I’d taken the long from previously and also the 00 level.
 

Attachments

  • EURUSD_24062013.png
    EURUSD_24062013.png
    56.1 KB · Views: 169
  • EURUSD_24062013b.png
    EURUSD_24062013b.png
    55.6 KB · Views: 164
Some charts from today.

I missed a pretty good trade in the morning (HornedGod's trade 1) because I wasn't up early enough (having some problems with sleep these last days).

Didn't take a great trade on EUR/USD, a false break of sorts (3rd chart).

Took 2 trades on EUR/JPY (charts number 6 and 7). I started watching this pair since Friday. So far it has offered numerous opportunities fitting Bob's method but the breakouts are more volatile and require less buildup than on EUR/USD.

The first trade was a break-even exit, the second yielded the 15 pips target (I use larger stops and targets on EUR/JPY because it behaves slightly less technically than EUR/JPY).
 

Attachments

  • 5 - Monday.png
    5 - Monday.png
    29.4 KB · Views: 166
  • 4 - Monday.png
    4 - Monday.png
    30.4 KB · Views: 205
  • 3 - Monday.png
    3 - Monday.png
    35.1 KB · Views: 160
  • 2 - Monday.png
    2 - Monday.png
    28.9 KB · Views: 156
  • 1 - Monday.png
    1 - Monday.png
    27.7 KB · Views: 175
  • 3.png
    3.png
    29.9 KB · Views: 192
  • 6.png
    6.png
    34.9 KB · Views: 159
Took one trade today. It seems valid, but prices went south pretty fast. I feel like I am missing something in the thought process, so I would really like some critique !
 

Attachments

  • 6 - Tuesday.png
    6 - Tuesday.png
    37.9 KB · Views: 121
Today was the polar opposite of yesterday. Yesterday I consider to be a pretty exemplary trading day: there wasn’t much overall price movement but I picked my moments and didn’t overtrade. Today was an example of just how not to do things. Pretty much every decision I made today was flawed.

It also goes to show what distracted trading looks like. Trading today pretty much took a back seat to trying to solve an issue that has been plaguing my PC for the last few weeks. Every so often my graphics driver decides to not respond, which results in programs freezing or in the worst case scenario a BSOD. I swapped in a new graphics card last night as I thought that was the prime culprit. It happened again with the new card in. ‘Right, that’s it’, I thought. I’d had enough. I wanted to get to the bottom of the issue. So while I was watching the chart I was also furiously googling to find out what solutions there might be. Hopefully, if anything good is to come out of this trading session it’s that I tweaked a few settings that will banish the issue forever. Only time will tell.

After going over Bob’s charts from last week, it was clear that I needed to work on identifying quiet markets so that I could stop overtrading in them. With that in mind, at the start of my session today I saw the 40 pip move that happened during the 2:00 EDT hour and thought there looked to be good liquidity and movement in the market today, even if the Asian session was flat lined.

1trade 1 – Bad entry. Entered on what is clearly a tease here. Had my tipping point on the double bottom formation (2-3), but due to the distraction today, I exited late forfeiting an additional two pips in the process.

4trade 2 – This was probably the only half-decent setup of the day. RB to fresh lows for the day. The 20 EMA was squeezing price out nicely. In hindsight I really should have moved my tipping point down to the high of 5 when the new low was reversed. If I had this could have been a break even or maybe even 1 pip trade.

6trade 3 – Frustration was mounting and I was basically desperate here. This range is in no-man’s land. There is going to be no double pressure if it breaks long or short and the chances of any follow through are slim. Why then did I take the long? I saw a chance to make back the majority of the losses from the first two trades. It was pure hope.

7trade 4 – And then after the long failed I saw it as a false breakout which lend more credence to taking a short now. But even that isn’t enough given the location of the range being broken out of.

Comparing yesterday to today also highlights how crucial it is to try and make days like this as infrequent as possible: if it takes two good days to make up for a bad day then bad days need to be like gold dust.
 

Attachments

  • EURUSD_25062013.png
    EURUSD_25062013.png
    56.5 KB · Views: 155
Took one trade today. It seems valid, but prices went south pretty fast. I feel like I am missing something in the thought process, so I would really like some critique !

Here's my 2 cents. Not every trade will work out - remember we're trading probabilities. That said, even though the overhead action wasn't too blocky, there was immediate support in the 40 level paired with a double top at the 50 level.

It also seemed to me there was a BB/IRB play a little earlier (see attachment). I wouldn't necessarily disagree if you thought that was too aggressive though.

Hope that helps....open to comment as well, I'm no expert!
 

Attachments

  • 6 - Tuesday.png
    6 - Tuesday.png
    71.7 KB · Views: 196
Here's my 2 cents. Not every trade will work out - remember we're trading probabilities. That said, even though the overhead action wasn't too blocky, there was immediate support in the 40 level paired with a double top at the 50 level.

It also seemed to me there was a BB/IRB play a little earlier (see attachment). I wouldn't necessarily disagree if you thought that was too aggressive though.

Hope that helps....open to comment as well, I'm no expert!

Yeah, you're right!

As for the IRB/BB, I play very safe with those but a nice catch nonetheless.
 
Comparing yesterday to today also highlights how crucial it is to try and make days like this as infrequent as possible: if it takes two good days to make up for a bad day then bad days need to be like gold dust.

Do you have a max-loss limit? I started imposing a two-trade loss limit on myself. I only came about this by looking at my trading logs. I noticed that 80% of the time if I lost more that two trades, it was going to be a really bad day. I've seen a pretty significant increase in my performance since then.

Maybe when I become a better trader it won't be necessary, but for now it's helping quite a bit.
 
Do you have a max-loss limit? I started imposing a two-trade loss limit on myself.

I don't have a set limit that I stick to at the moment. I don't have enough trade history to know if things go decidedly downhill after two losses, but I'd guess that they probably do. I am pretty mindful when it comes to making that third entry but as yesterday showcased all it does is highlight that I'm not being patient enough.

I think have a limit of two is a pretty good rule-of-thumb but I'm not sure if the pros of downing tools to prevent my emotions trying to make back those losses is worth the lost trading time (of which I only have a limited two hours per day) and also losing the opportunity to work and fix my psychology. Definitely something I'll have to keep in mind and if I can't resolve the underlying issues then having that rule in place to prevent me sabotaging myself would be a good thing.
 
Today was a step up from yesterday. I know that there’s a fine line when it comes to trading profitably on a consistent basis. The best I’m able to do right now is waver around that line: sometimes on the positive side, sometimes falling slightly short. As long as I keep well within reach of that line I consider it to be a good day. With enough practice and experience I think I’ll edge closer and closer to staying on the right side. For now though, the most important is not to get knocked askew like yesterday.

1trade 1 – In hindsight I don’t think this is a great entry. At the time I was wary of the preceding price action around 1.3070, but after a series of 4 lower lows, and two tease breakouts I thought it worth taking the RB at the time. I was probably too impatient; if there’d been some more pre-breakout tension at the support level then it might have stood a better shot.

3trade 2 – After putting in a false break (2) a break out the top side of the range looked to be a good bet. After from some resistance that might be offered by the 80 level I can’t see much wrong with taking this signal.

5skip 1 – I saw this RB setup but decided not to take it. My main con at the time was the bump up at 4. I didn’t see the fact that the EMA capped this bullish attempt and thus lessened its significance (even if it did mean a doubling of any tipping point level from two pips to four).

If I’d been on the right side of the fine line today I would have skipped trade 1, still taken trade 2 and entered on skip 1. Such is life trading on the razor’s edge.
 

Attachments

  • EURUSD_26062013.png
    EURUSD_26062013.png
    71.2 KB · Views: 185
I think have a limit of two is a pretty good rule-of-thumb but I'm not sure if the pros of downing tools to prevent my emotions trying to make back those losses is worth the lost trading time (of which I only have a limited two hours per day) and also losing the opportunity to work and fix my psychology.

I know what you mean. On my bad days where I max out quickly, I switch over to paper trading. Magically, I always seem to do better after I switch...I would guess it has something to do with the fact that I *really* don't care about the trade outcome when I'm paper trading. Bob mentions it several times in his book and it's really true: only when you stop caring about the outcome of an individual trade, will you start trading well.
 
Top