You are using an out of date browser. It may not display this or other websites correctly.
You should upgrade or use an alternative browser.
You should upgrade or use an alternative browser.
BLS
Established member
- Messages
- 642
- Likes
- 229
Hey guys,
So before I post my charts for the day... I've been really struggling with this notion of becoming a day trader/scalper. Reading somewhat mixed opinions about it. I know that most of the negativity is fueled by the disillusioned/failed traders, but I do feel a little bit discouraged, even though our method seems to be a very solid foundation for a trading career.
here's one slightly negative article 8 Reasons Why You Should Never Become A Day Trader - Business Insider
(I'm sure we can find tons more with the obvious "95% of traders fail" comment)
Tell me what you think.
In the end it's up to you to figure out if your personality, psychological makeup, lifestyle, etc fits with the given trading method. There's not much substance to the article you linked other than broad statements and tidbits from his personal life. Sounds more like a rant than anything else. If there's any consolation it's that scalping is unlikely to create those outsized losses that he mentions (not quickly anyway).
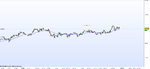
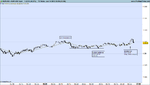
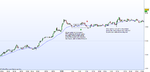
E1: One trade today. Not the best looking trade at first glance but I thought the bulls were doing pretty well with all the buildup they were putting in prior the news release (Prelim UoM Consumer Sentiment). The picture looked even better after a ceiling test was put in and a squeeze formed right above the 20 level. More of an ARB than an RB I guess.
Attachments
Again, I would encourage you to squeeze the vertical width of your chart to match the vertical scale of Bob's charts.
I format my screengrabs at this size mainly for my blog so that they're viewable fullsize on a 1366x768 display. I actually trade with a much larger chart display.
I've experimented with having only the 20 levels shown on the vertical. To me it added not enough and only made it harder to see individual pip movements. I've found the 10 levels visible to be the best compromise for seeing what's going on while also being 'zoomed out', although that often depends on how much trending action there's been in the past few hours anyway (as to how much vertical movement price has taken).
Today's action:
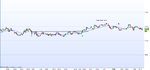
Trade 1: Nice little block break right up against the 50 level. Trend since the close of yesterday's US session had been decidedly down.
Skip 1: Countertrend signal. I didn't see enough space to get a good 10 pips given the previous pauses around the 1.3340 level so I skipped.
Attachments
BLS
Established member
- Messages
- 642
- Likes
- 229
Week 24 charts from Bob:
https://www.dropbox.com/sh/1amxmi9af0fk6ej/VA5_ZrjQF1
https://www.dropbox.com/sh/1amxmi9af0fk6ej/VA5_ZrjQF1
matty_dunn
Active member
- Messages
- 188
- Likes
- 17
Week 24 charts from Bob:
https://www.dropbox.com/sh/1amxmi9af0fk6ej/VA5_ZrjQF1
Thanks Bob and BLS!
garageboyFUJI
Member
- Messages
- 66
- Likes
- 0
Thank you Bob, BLS.
I really appreciate what you've done.
I really appreciate what you've done.
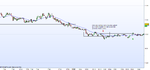
1 – skip 1 – The way I drew my range here, with the top being at 1.3328, meant that there wasn’t enough pre-breakout tension for me to consider entering a RB. There’s a strong case for making the top of the range one pip lower at 1.3327, since there were many more touches at that level. Given the false break out south, I probably should have gone with the slightly more aggressive level and taken the long entry.
2 – skip 2 – Again, not enough pre-breakout tension for me see this as a valid BB. I wanted to see a strong build-up if price was going to attempt to breach the 50 level on its way to any TP level.
3 – trade 1 – I was ideally looking for a long entry to develop off the top of this block. As price ground lower I started to consider the possibility of a countertrend entry south, especially given the double top near the 50 level that had just formed. My chosen block is pretty ragged, with no clear cut bounce from the bottom of the block to the top and back down again. In the end, price did push out the bottom but there was no momentum and I covered on a break above the top of the block.
I think this entry was fair at best. A useful question to ask myself I realised while analysing this trade is: ‘If I had taken 1, the first skip today, would I have been happy to risk giving back some of those pips given the quality of this signal.’ The answer is no. The setup just isn’t strong enough; the block isn’t defined enough. I should have skipped.
I know that every trade stands alone. Probability rules. The fact that I’ve put on a trade already, or whether it was a winner or loser, has no impact on the chance that a follow-up entry will be a winner or not. Each trade is truly independent. I know that; but still thinking about it in this way seems to help clarify the validity (or lack of in this case) of a signal. Whether the same would be true in real time I don’t know yet. We’ll see if I think about it in that way going forward.
Attachments
Hi I'm Dennis i bought and study bob's book months back and applied it to a 1m chart on a mt4 platform it does work but its really slow compared to the 70 tick chart he stated so now i use prorealtime as well,.. i joined this forum to read this thread amazing hats of the the people who keep this thread going 🙂 i'm starting to read this from page one so thats a lots of additional material thanks
i have question for the people who have used bob's method for a long time what time do you usually see a lot of volume and movement in the market? if you can tell me in prorealtime's time scale will be nice 🙂 thanks in advance
i have question for the people who have used bob's method for a long time what time do you usually see a lot of volume and movement in the market? if you can tell me in prorealtime's time scale will be nice 🙂 thanks in advance
JRS
Member
- Messages
- 59
- Likes
- 23
Giorrgi
Well-known member
- Messages
- 253
- Likes
- 0
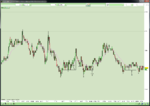
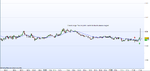
One trade today. The chart that I'm showing you here has been reloaded and that changed the shape of the bars a little bit (there was a single bar instead of the last two dojis before the break).
Pretty bad day today.
JRS and AkiraDJ, great to have new people on board !
JRS - I don't think that trade matches the requirements, but you're using MB Trading data stream and they display prices differently (less bars so buildups are harder to notice).
That false break was skipped on the account of lack of buildup. Usually in range break you want to see prices really stick to the top barrier for a couple of bars before breaking out (the EMA "squeezes" the bars out).
HornedGod - that first trade from yesterday reminds me that I skip a lot of these trades where prices breakout from a zone just lower than the barrier that I drew. Sometimes it is helpful to look for a buildup of dojis to situate the barrier, ie. the dojis display where the fight is being fought and from where the break will actually occur. Therefore, nowadays when I draw a barrier line I look for clues as to its true level by looking at prebreak out tension.
This is a double edged sword though as sometimes what seems like a pre-breakout doji situation ends up receiving no follow through upon its break. I have numerous examples of these types of "traps" that I have fallen into (check second attached chart, number 15). There's a fine line to walk here. In your chart, the break of those dojis could have been held back by the the line that you actually drew, ie. the level of those two preceding tops.
Attachments
Last edited:
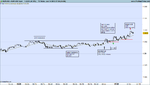
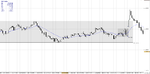
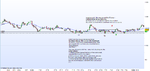
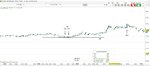
1 – skip 1 – This was a nice RB setup that had built up over the past hour. The reason I didn’t take it was that the market had been in a decidedly bearish mode since yesterday afternoon. I keep forgetting to take into account the increased liquidity that the London session has and how it often dictates things, rather than following. I really should have taken this entry given that.
2 – trade 1 – With the strong break out of the range that I had skipped on at 1, price pulled back from a test of the 50 level. The 5 sideways doji bars were enough for me to put on a DD trade. Since the biggest doji was only two pips tall I debated whether to add an extra pip to my tipping point. In the end I decided not to. Lo and behold and I got taken out on a false break of the doji low. Price then did that most infuriating thing, where on a third attempt it broke through the 50 level. My TP would have easily been hit if I hadn’t been shaken out.
3 – trade 2 – Undeterred I settled back to see if the bulls were out in force. It seems like they were. After breaking through the 50 level decisively, the most the bears could conjure was an extended (8 candle!) block that was one pip high. This seemed like a prime BB continuation play. I entered on the first break above the block and price rocketed up to hit my TP.
5 – trade 3 – The move at 4 was a classic first break continuation of the trend. There wasn’t enough pullback for me to want to take it at the time. Instead I waited for a more pronounced pullback which soon followed. After that FB I thought it would be better to wait for a higher probability SB. Technically, the SB happened at 5. In hindsight, while that was technically the SB, 6 is where the actual tradeable SB took place. I took the entry at 5 when I should have probably waited for a better formed second pullback to take the SB from. I had to close this trade out for a 6.2 pip loss and wasn’t alert enough to take the immediate long that was the proper SB entry point.
7 – trade 4 – Instead I saw a block form and started to wait for another opportunity to go long. This happened at 7. There was a push to a new high but it didn’t make it to my TP before price pulled back below the tipping point that I had moved up to the double bottom at 1.3387.
While I had checked the Forex Factory calender at the beginning of the session to see what data releases where going to be released before 5:00 EDT, I failed to take note that the German ZEW Economic Sentiment was to be released at 5:00 EDT. While I was taking screengrabs of my charts I noticed that Oanda’s spread had gone to 15 pips. I quickly latched onto the fact that I’d missed noting a big data point. As the spread settled down I saw a chance to go long. I decided not to take it since I hadn’t been vigilant enough to notice that there could be a good trade setup beyond the 5:00 EDT end point that I normally stop at each day. I didn’t want to potentially reward myself for being lazy.
Attachments
i have question for the people who have used bob's method for a long time what time do you usually see a lot of volume and movement in the market? if you can tell me in prorealtime's time scale will be nice 🙂 thanks in advance
The most liquid times of the day are the start of both the London and New York sessions. The London session is still the most liquid. Market hours can be found many places online such as at forexmarkethours.com.
You can set what time zone is displayed on your prorealtime charts via the Options->Set time zone and trading hours menu option. Select Forex 47 Major Pairs in the list on the left hand side and then choose what time zone you want displayed. Personally I use the time zone of my computer.
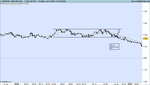
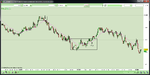
I'm going through some of Bob's trades (what a great resource!) and stumbled on this one. I must admit, I would probably have taken the false break. Can anyone share their ideas on why this RB should be skipped?
I assume you're talking about the small long false break shortly before the IRB short? The main reason why I think Bob didn't take that is due to the time of day: lunch time. The chances of a successful breakout during the lunch time doldrums is pretty low. There is a far higher chance that the market will continue to be range bound.
With that in mind it makes more sense to look for short opportunities near top of the range. With the two false breaks you probably have enough longs that entered that would be squeezed on any short back into the range, which makes the short IRB a good entry (good double pressure).
JRS
Member
- Messages
- 59
- Likes
- 23
I assume you're talking about the small long false break shortly before the IRB short? The main reason why I think Bob didn't take that is due to the time of day: lunch time. The chances of a successful breakout during the lunch time doldrums is pretty low. There is a far higher chance that the market will continue to be range bound.
With that in mind it makes more sense to look for short opportunities near top of the range. With the two false breaks you probably have enough longs that entered that would be squeezed on any short back into the range, which makes the short IRB a good entry (good double pressure).
Yeah, that makes sense. Thanks for the reply!
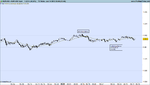
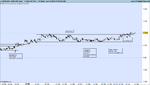
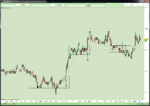
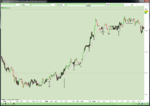
After yesterday’s strong moves things seem to have quietened down. Today’s FOMC announcement later is probably playing a big part in keeping things subdued for now. The range in EUR/USD seems to be stuck between 1.3387 and 1.3410. Saw a touch of both these levels in the first 30 minutes.
1 – trade 1 – Coming off a test of the support level at 1.3387, price entered a 5 pip block near the bottom end of the range. I entered an IRB trade on a break of the block. 1.3400 was pierced but TP was not reached.
2 – skip 1 – After a double bottom was put in by 3 and 4 another block formed, this one much narrower. After the resistance shown by 1.3400 on my first trade I was hesitant to enter another IRB. In hindsight this one was probably the better of the two and I should have taken it. The double bottom test of the range support added extra credence to that support level. The block was much more compressed which had the potential to lead to a greater surge out of it. The block was also lower down in the range. While the previous entry at 1 only moved 4 pips before hitting the 00 level, an entry here would have the opportunity to move 7 pips.
5 – trade 2 – Same rationale for this entry as the previous two. The block is nowhere near as nice as the previous two and I had doubts as to whether it was worthy of being valid. After seeing how an entry at 2 would have been successful I decided to just play the percentages and take the trade.
Attachments
BLS
Established member
- Messages
- 642
- Likes
- 229
I assume you're talking about the small long false break shortly before the IRB short? The main reason why I think Bob didn't take that is due to the time of day: lunch time. The chances of a successful breakout during the lunch time doldrums is pretty low. There is a far higher chance that the market will continue to be range bound.
Yeah, that makes sense. Thanks for the reply!
Please see:
That false break was skipped on the account of lack of buildup. Usually in range break you want to see prices really stick to the top barrier for a couple of bars before breaking out (the EMA "squeezes" the bars out).
With that in mind it makes more sense to look for short opportunities near top of the range. With the two false breaks you probably have enough longs that entered that would be squeezed on any short back into the range, which makes the short IRB a good entry (good double pressure).
This part is correct.
garageboyFUJI
Member
- Messages
- 66
- Likes
- 0
The most liquid times of the day are the start of both the London and New York sessions. The London session is still the most liquid. Market hours can be found many places online such as at forexmarkethours.com.
You can set what time zone is displayed on your prorealtime charts via the Options->Set time zone and trading hours menu option. Select Forex 47 Major Pairs in the list on the left hand side and then choose what time zone you want displayed. Personally I use the time zone of my computer.
thanks for that i checked it out its helpful,.. 😀
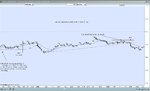
Did anyone notice the lack of volatility of EUR/USD yesterday lead to a big plunge from ranging in the round number 1.34 down to 1.326 in a matter of an hour. i viewed the calming of the market yesterday as a sign of an upcoming news release that will trigger volatility after it. as the market closed yesterday it plunged. i think i remember bob mentioned this in his book that you will see in the price action whether the market is expecting an upcoming news release.
was this an example of what bob was saying in his book? that price action will show me that there might be news upcoming? or was it just coincidence?
cause i'm still not sure if my decision to stay out of the market yesterday was a good idea cause i saw many people traded
Similar threads
- Replies
- 15
- Views
- 9K