Big Ben on the FTSE100

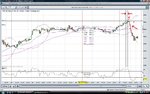
nice work. i've been trading the 37 and 50 ema bands with the help of a guy on another thread who trades bunds and eurostoxx. they seem to give a 'band' effect and we've been shorting rallies to the bands on 5m and 15m charts with tight stops and decent targets.

it's worked quite well and give a nice secure feeling seeing that green band below you when you're buying at what in the immediate time scale looks like a falling market.

i've been keeping an eye on bb and using the 8-10 range levels when they've tied in to my own thinking.
 
Out for 25 ticks profit shorting Dec FTSE. Waited to put my orders in after Sep. expiry at 10.15. Sadly halved my position as downside trigger hadn't taken place before close 10-12 candlestick.

I reduced trade size right from the start., so mine is ok, but just that!

I'm out. I'm so unlucky when I'm at work! 40 points that I don't want to lose.
 
Tom,
Have I set the 8am to 10am parameters correctly?
Do you incorporate the high/lows of each candle?
If so then the last few days have not been great days and today has seen a false break upwards followed by a nice break downwards.
 

Attachments

  • fri.jpg
    fri.jpg
    206.5 KB · Views: 187
Tom,
Have I set the 8am to 10am parameters correctly?
Do you incorporate the high/lows of each candle?
If so then the last few days have not been great days and today has seen a false break upwards followed by a nice break downwards.


Right on both counts neil. Big Ben needs a fairly wide daily range to be successful, as price has a lot of 'travelling' to do. All week we were stuck in a very narrow daily High-Low range until yesterday when price broke above Tuesday's high - a false move as you say.

BB has logged 10 sessions in the last 25 days where price broke out and hit target. The full daily High-Low range on these days averaged 95pts: the average daily H-L range this week has been 52pts: without Friday, only 38. BB is pretty much not worth the risk if the daily range is so low - the next question is, how is it possible to tell a sessions's daily range at 10am?
 
Of course, if the daily range is low, the Big Ben range was probably low too, and this tends to follow - so far, the Big Ben wins average +39pts, whereas the average where the stop has been hit is -30pts. That's not to say (yet) that trading a Big Ben range of only 29pts say is uneconomic, but it might support only a smaller position size.

This is a contrary way of looking at the trade -
wide stop = high risk = large position;
narrow stop = low risk = small position.
- not the usual decision process.

On the other hand, the wider the Big Ben range, the less likely it is that price could re-cross it from side to side. Still thinking this through.
 
i'm not long, just tracking it. personally i wouldn't want to be long here but the trade is in profit so could always get a break even stop in and leave it to see what happens. i didn't want to be long 30 points lower and it kept coming so every chance it will again
 
No Big Ben trade for me today: 0800-1000 range is 82pts, way beyond 75% ATR limit. Back tomorrow.
 
My results seem to suggest that when ATR is low, trading the Big Ben break-out has a poor win rate, whereas trading retracements from the Big Ben range boundaries might be more attractive. Holding off trading the Big Ben today but the retracement tactic looks attractive - bounce off the lower BB boundary this am is already in positive territory.

I will put up a rolling review of BB opportunities this weekend. I will also look further at the possibility of a 'reverse Big Ben' trying to confiorm this is a real effect, not just an impression. In detail will then need to establish -
ATR threshold to flip Big Ben into Reverse Big Ben
profit target for Reverse BB
stop level for Reverse BB
 
Certainly does. I've been inclinbed to take a contrarian view of this system but I got caught this time. :!:

Yes, and posts on this have encouraged me to keep thinking this through thank you. It does seem that ATR is a useful filter and I will have a proper look at the weekend. The BB range itself is too variable: the daily range would be helpful but is only known after the event: the previous day's daily range is not a usable predictor of the subsequent daily range: BB tranges do not predict subsequent day's BB ranghes either: the 08:00-09:00 range does not indicate what happens 09:00-10:00 sufficiently accurately.

An interesting puzzle.
 
Weekly review of Big Ben trades. 6 weeks of trades so far, 30 sessions (including August Bank Holiday) -
12 closed at profit target = +451pts (av. +38)
6 closed at stop = -192 (av. -32)
5 expired for minor gain
3 expired for minor loss
4 sessions no trade taken
I haven't tracked the exact gains/losses from expired trades, just assumed these would average out each at 50% of the Big Ben range concerned, and as long as the winners at least balance the losers I'm not going to worry about them.

The closed trades are 2:1 winners:losers and give a net gain of +259pts. It's not a huge return from 18 trades over 6 weeks. On the other hand the TA / book-keeping involved is minimal. Over my particular 30-session period, the equity curve went negative on Day 3 but was permanently back into the black on Day 6, but I have to recognise that the last 3 weeks has been tough: starting Big Ben trading on Day 19 would see you still in negative territory.

I have to leave it to the individual to gauge whether this is a viable and desirable return but I see no reason to abandon this modest strategy.

Meanwhile, I will review the last 3 weeks separately and suggest ideas for dealing with such periods later.
 
Top