Becoming a successful forex trader

Hi

See the advance signals highlighted.Indicator only has to be right 6 out of 10 times and is combined with a few filters

Early days yet and not quite finished with the settings

OILFXPRO
 

Attachments

  • probability manager indyEDITED.JPG
    probability manager indyEDITED.JPG
    265.1 KB · Views: 238
Happy Easter.....................Gone

I will second that

I can"t take it amy more

I am offfffffffffffffffffffffffffffffffffffffff

good weekend all

sure it works fine

Andy
 

Attachments

  • saturn.jpg
    saturn.jpg
    1.9 KB · Views: 553
  • mars.jpg
    mars.jpg
    2.5 KB · Views: 552
  • moon.jpg
    moon.jpg
    2.1 KB · Views: 585
  • earth.jpg
    earth.jpg
    3.8 KB · Views: 566
  • images.jpg
    images.jpg
    2.1 KB · Views: 571
Last edited:
I particularly like signal 2 and 4 which occur after his alleged entry !, and of course some signals are 2 bars early, whilst others are 30 bars early !

They are early cause futures:clap: are meant to be.This is real futures trading

OILFXPRO
 
MP -- with some trepitation, my "probability" thingie

Hi

See the advance signals highlighted.Indicator only has to be right 6 out of 10 times and is combined with a few filters
Early days yet and not quite finished with the settings
OILFXPRO
=========================================================================
Its very pretty Oily, and could be worth countless millions in profit ---- whose to say ?

Ive attached my free "probability indicator" with some misgivings ---- being free it doesnt compare with the tuxedo'd group that your indicator hangs around with (considering your pricing, its sort of a prince and the pauper situation, I guess)

But I offer it up, nervously of course, because it is so below what you show ---- I ask that you not say too many things of a negative nature as the little indicator is extremely insecure, even though its present record is only one loss of $10 because I had made an error in what currency i wanted to buy, and so cancelled the trade at a loss.

the little indicator was obviously shaken by that experience and i was forced into flipping currencies for the rest of the day, so as a fellow trader, please dont insult it too badly---- i need it to be reliable 100% of the time !

thank you Oily, I knew you would be kind to her

mp
 

Attachments

  • mikeys el cheapo probability meter.jpg
    mikeys el cheapo probability meter.jpg
    173.6 KB · Views: 221
I particularly like signal 2 and 4 which occur after his alleged entry !, and of course some signals are 2 bars early, whilst others are 30 bars early !

Zupcon

This is a probabilistic adavance signal generator.It tells where the market is likely to go.It is early day and we are still testing and adjusting the settings and optimising.

It does not signal when exactly the market will make the move.It is used with moving averages etc and the moving averages gives us the timing for the entries

The timing of the entry is not what the indicator was designed for

OILFXPRO
 
=========================================================================

thank you Oily, I knew you would be kind to her

mp

M P

What about repainting on your charts?

The difference between my and your indicators is as great as between lions and hyenas.The lion hunts and the hyena looks for for free food after being hunted by the lions

Fundamentals is king!

OILFXPRO
 
M P

What about repainting on your charts?

The difference between my and your indicators is as great as between lions and hyenas.The lion hunts and the hyena looks for for free food after being hunted by the lions

Fundamentals is king!

OILFXPRO

I've said it before, and I'll say it again, fundamentals are far from being king particularly if your messing around at the sort of time frames that your using to demonstrate the effectiveness of your indicator.

Prove this to yourself if you wish. Get a chart, and draw 2 vertical lines marking the start and end points where fundamentals suggest a bullish bias. Now find a period on the chart where fundamentals suggest a bearish bias.

Next, using whatever system you use for signaling entries / exits, determine the distribution of winning and losing trades for longs and shorts in each period. Now compare the distributions for the long trades and see if they are significantly different. Did your longs from the period suggesting a bullish bias do better than the longs taken in the period with a bearish bias ? You can use the same basic technique for any filter that you wish to evaluate.

I would suggest to you that you'll find that If your messing around intraday (such as your 5 minute system), there is no statistically significant difference.

Now MP's selection of indicators (although subject to repainting) are far more appropriate for intraday trading. They provide the user with pretty much all the basic elements one needs, an indication of the major trend which is relevant to the time frame you wish to exploit, an indication of intermediate trend, the use of channels which gives a reasonable framework with which to identify high reward low risk entries, a measure of historic support and resistance, and a couple of oscillators to fine tune entry. What more could you possibly ask for as a foundation on which to start building a strategy ?

Like it or not, prices move in channels with alarming regularity, and very often within well defined statistical boundaries (I still cant help stifle a laugh when I recall CYOF's classic comment "what has standard deviation got to do with trading"). Price bounces from one edge of the channel to 't' other, trends don't turn on a sixpence, they persist, and basic technical analysis is an adequate tool for identifying appropriate entry and exit points.

Once all of the cornerstones are in place, you can start thinking about probabilities, but mixing long term fundamentals, with short term technicals isn't at all sensible, as its an ineffective filter.
 
Zupcon

I do not see any problem in using it intraday ,with moving averages.It also calculates intraday probabilities on technical anylysis used by M P

For lower time frames one needs to adjust to quicker moving averages and different settings on indicator

The probability manager also calculteas intraday probabilities.:clap:It also reads and calculates price action and chart patterns.So I just follow the indicator and intraday trends

I only want to be right 6 out of 10 times

OILFXPRO
 

Attachments

  • prob 5 m.jpg
    prob 5 m.jpg
    367.2 KB · Views: 220
Zupcon

Here is an example from today's 5 m charts towards the right of the cHarts entries

Probability manager is down before the price drops.Good scalping trades

OILFXPRO
 

Attachments

  • prob 5 m 2.jpg
    prob 5 m 2.jpg
    297.9 KB · Views: 216
M P

What about repainting on your charts?

The difference between my and your indicators is as great as between lions and hyenas.The lion hunts and the hyena looks for for free food after being hunted by the lions

Fundamentals is king!

OILFXPRO
=====================================================================

on another site, I went into a complete discussion of "repainting", which a few years ago I considered "bad", as do most, but with observation I discovered that all that was happening is that the zigzags and their accompanying arrows were simply "dynamic support and resistance areas" and that the whole thing might get you into a trade early, but that trade was ALWAYS CORRECT.

with experience using the zigs and arrows, one can play it till you get bored of making money, and if youre playing the shorter timeframes, as zup pointed out, you will always be spot on ---- people who never used to make profit are now pm and emailing me with joy --- theyre finally making money by playing the two sides of the channel.

Playing the longer timeframes, one gets out when an arrow appears and takes profit --- YOU MAY BE GETTING OUT A FEW PIPS EARLY, and if so incined can then play the resultant moves as a day trader, BUT IF YOU GET OUT AT THAT POINT YOU WILL ALWAYS BE A WINNER ! WHAT YOU DONT DO NOW IS IMMEDIATELY TAKE A COUNTER TRADE, AS YOU WANT TO SEE WHAT DEVELOPS FIRST, but I can tell you one thing, the currency WILL move in the direction of the arrow --- usually by midnite, est when the Japanese market reverses the trend !

Now, while theres more to it than simply playing the channels, its a decent start, BUT one must ALWAYS take into consideration the support and resistance points (the red and blue dots) and not bet the farm on the price actually reaching the top and bottom of the channel, although in a downtrend, you can bet a lot on hitting the BOTTOM channel, but I would be VERY careful of betting that it would always hit the top channel ---- and vice versa for an uptrend.

While the price always moves from one side of the channel to the other, on the longer timeframes it does not always happen in a short amount of time, but as you can see, the price had hit the BOTTOM channel, and then started UP towards the TOP CHANNEL --- it just took a while to get there, but we would always bet anything that IT WOULD INDEED GO TO THERE.
So in this way, not only do you get "probabilities" mixed in, but full technical analysis which is disregarding the fundamentsls because any movement altered by fundamentals is, as we say, already priced in and noted !

these days Oily, almost every analyst is agreeing that technicals are now ruling the market, or it would not be as volitile as it is --- traders are running up the prices of commodities, stocks and forex and futures and options, reaching a predetermined resistance point, and then selling and shorting the decline. You see it everyday .

Please notice the attached chart ---- the two channels are "long range" (GREEN) and short term (YELLOW) --- see where they met ? at that point, resistance from both channels meeting at a top resistance point, the currency dropped ---- Now, per any decent traders plans, you either go flat and wait to see if the short side will continue or take advantage of what may probably be a short move UP, and then a short that "should" break the channel and head for the AQUA line, which is the 200ma --- I am not the holder of the magic wand, but I would watch next week carefully for what may happen, as the "ACCUMULATION" indicator is showing pretty close to the point where it should sell off completely, which will require a bit more move to the upside, and then the downside move will set in.

It wont happen in minutes, but it am sure giving signs that it WILL happen, which was what our bet was supposed to cover !

Your fathers market was run a lot on "fundamentals" but TODAYS market is different, and most probably because of retail traders, computers and the internet ---- ITS JUST THE WAY IT IS NOW OILY ---- YOURE LIVING IN A PAST MARKET, and it proves it to you every single day, all you have to do is understand and watch !

Any books you quote tend to be "out of date" simply because the market has changed completely thru the use of the computer ---- IF PEOPLE TRADE ONE WAY, THEN THATS THE WAY THE MARKET MOVES, and I simply cannot produce more proof of what I say than I have done ---- to ignore the truth is kinda silly !

Take a good solid look at how prices are moving, and you will sooner or later have to understand ---- THIS AINT YOUR FATHERS MARKET !!

enjoy and trade well

mp
 

Attachments

  • OILYS EUSD W LRC CROSSES.jpg
    OILYS EUSD W LRC CROSSES.jpg
    202.6 KB · Views: 280
Last edited:
Mp -- Addendum To Recent Post, Re: Zigzags And S+r

Ive been observing many methods on this and other sites, first because Im not silly enough to think I know it all and secondly, to see if theres anything actually "dangerous" to a newbs experience.

what i see is a number of systems that bring you into a trade a bit late, either because some exotic indicator has to actually determine a trend change, or the moving averages have to wait till they cross or any of a number of reasons, and while this is easily documented (simply look at the entry points these systems point to and you will see the entry is invariably LATE) but the EXITS are also LATE, taking place as far down as a 1/4 of the total move up --- ie: the price reaches top resistance, reverses down and 1/4 of the total distance of the upside move, you get a SELL signal ! THAT is a lot of pips to give back to everyone !

While giving BACK pips may not bother some, it irritates the heck out of me and the only method I have so far found that DOESNT give back pips is the zigzag used in combination with the s+r overlays. One simply exits at the logical exit, takes their profit, and can then turn their attention to another currency, or wait out the one they were in and see what it has in mind, playing it that way !

I dont push it or scream for people to use it, but it sure works for me and thats really all that counts in my trading life !

I just like to keep the pips I made because I cry so easily, and i hate to cry over spilt pips !

enjoy and hang onto your pips (and anything else impt to you !)

mp
 
This is absolutely correct.

There is NO value in applying fundamentals to a short timeframe trade. If you were applying fundamentals to determine an overall weekly/monthly trend and then positioning with it on daily/4hourly charts to ride it then they would make sense but applying fundamentals in 5m timeframe trades is a bizarre thing to do.


I've said it before, and I'll say it again, fundamentals are far from being king particularly if your messing around at the sort of time frames that your using to demonstrate the effectiveness of your indicator.

Prove this to yourself if you wish. Get a chart, and draw 2 vertical lines marking the start and end points where fundamentals suggest a bullish bias. Now find a period on the chart where fundamentals suggest a bearish bias.

Next, using whatever system you use for signaling entries / exits, determine the distribution of winning and losing trades for longs and shorts in each period. Now compare the distributions for the long trades and see if they are significantly different. Did your longs from the period suggesting a bullish bias do better than the longs taken in the period with a bearish bias ? You can use the same basic technique for any filter that you wish to evaluate.

I would suggest to you that you'll find that If your messing around intraday (such as your 5 minute system), there is no statistically significant difference.

Now MP's selection of indicators (although subject to repainting) are far more appropriate for intraday trading. They provide the user with pretty much all the basic elements one needs, an indication of the major trend which is relevant to the time frame you wish to exploit, an indication of intermediate trend, the use of channels which gives a reasonable framework with which to identify high reward low risk entries, a measure of historic support and resistance, and a couple of oscillators to fine tune entry. What more could you possibly ask for as a foundation on which to start building a strategy ?

Like it or not, prices move in channels with alarming regularity, and very often within well defined statistical boundaries (I still cant help stifle a laugh when I recall CYOF's classic comment "what has standard deviation got to do with trading"). Price bounces from one edge of the channel to 't' other, trends don't turn on a sixpence, they persist, and basic technical analysis is an adequate tool for identifying appropriate entry and exit points.

Once all of the cornerstones are in place, you can start thinking about probabilities, but mixing long term fundamentals, with short term technicals isn't at all sensible, as its an ineffective filter.
 
There is NO value in applying fundamentals to a short timeframe trade. If you were applying fundamentals to determine an overall weekly/monthly trend and then positioning with it on daily/4hourly charts to ride it then they would make sense but applying fundamentals in 5m timeframe trades is a bizarre thing to do.

Great point :smart:
Fundamental hardly being reflected in the short time-frame.
 
T2W is pleased to have vendors participating in our forums. We invite this mainly so that they can support enquiries from their customers amongst our members but also so that they may participate as members if they choose. The vendor tag provides openness and lets people know that there is a potential vested interest.

Despite this, vendor members may not advertise on our forums. Paid advertising is available if desired and is controlled by T2W admin.

Volunteer Moderators spend considerable time deleting and banning drop in spammers. We also advise Vendor members not to advertise, typically by way of links within posts or within their signatures. Most comply willingly and participate to support their customers or simply to post as members (with an openly declared interest).

Unfortunately oilfxpro was perceived to be acting as an advertiser, initiating large numbers of posts and threads apparently aimed at generating interest for his paid product. When asked to cease posting links he complied but then moved to other techniques to attract potential customers.

Oilfxpro has been banned. Sorry if any inconvenience is caused.
 
seeing what you said jerked me up short

what i see is a number of systems that bring you into a trade a bit late, either because some exotic indicator has to actually determine a trend change, or the moving averages have to wait till they cross or any of a number of reasons, and while this is easily documented (simply look at the entry points these systems point to and you will see the entry is invariably LATE) but the EXITS are also LATE, taking place as far down as a 1/4 of the total move up --- ie: the price reaches top resistance, reverses down and 1/4 of the total distance of the upside move, you get a SELL signal ! THAT is a lot of pips to give back to everyone !

While giving BACK pips may not bother some, it irritates the heck out of me

What I'm Sayin', mp!

Retracement entries are nothing new but that's what I use. They make for nice entries along a trendline. The only problem is that at a main trend pivot that strategy loses money. So I have been just going in on the retracements immediately AFTER a trend change. The entry is by a trigger that first is selective due to it being based on a key I found in each elliott wave. So it weeds out the trend continuation retracements and targets the turn.

Now this elliott wave key is something I discovered over many years of research. It is generated by the wave itself and so has the integrity of the elliott wave. But you don't need elliott wave knowledge to do it.

But seeing what you said about the indicators being "exotic" jerked me up short. Check out why:

I have discovered many new things as a result of finding that key. One was a particular technical analysis setup. That in turn led to a signal which because of being "keyed up" on the wave's key was remarkably letting me know whether the trend pullback was a trend failure or whether there would be a continuation after the pullback.

The experienced traders at this point are probably thinking that this must relate to timeframe. It absolutely does. The relationship is so critical that this is the reason that software or Expert Advisors have a real disadvantage in the area of recognizing the difference between continuation and failure.

They rely on oscillators and trendline breaks and the like. But the price action is way too complex for that. We all know that trendline pullbacks come in several varieties from the shallow to the deep and from the sharp quick snap to a cautious stair step to that drift that seems to last FOREVER (followed often times by the sharp quick snap).

Think about this: How long have we had the technology to make humanoid like robots yet we do not see them? We have extremly sophisticated robots that build whole cars but each task is given to a "sophisticated" bot that performs basically one task. It does it REALLY WELL. Just don't ask it to do the task of the one that is two bots down the line. Robotics stalled out when they tried to tackle some of the most simple human tasks. And the fantastic physics based machine is sitting there waiting for its brain, the logical machine still an infant.

And this forex action will shake every single one of those algorithms out just before it goes on to finish the move - often the best part. The proof of that is that if there REALLY WAS a software solution to the complexity of the market everybody would have retired, this group forum would not be here and you would not be reading this.

So here you are reading this and your intention is to improve your technique. After all you are the "human" in the humanoid, right? You have the pattern matching skills any programmer would give his right arm to be able to copy (yeah, I think they are still having trouble with resaurant menus). Well we are also the problem to the solution.

Yes we can spot patterns and even remember them really well. We can also remember when the same one that turned out to be a buy, on another occasion turned out to be a sell. I know all my indicators take a special pride in not revealing when either situation will apply. That is inherent because an indicator IS a robot. Pattern matching is good, its important, but it is also somewhat a robotic function.

You can bet that in a competitive environment if you think the pattern or the indicator "says" this or that then there are automatically engaged forces kicking in that will drive traders and now even computer programs towards AND against that tendency. Of course, there will even be emotions at work. Will those forces balance each other? Yes and no - or up and down - you get my drift.

The whole point of all this? Well I have wandered a bit from the timeframe issue but it really is necessary to assure you that the software is NOT the answer. And the indicator is NOT the answer.

The answer is in the balance of the forces at work which create a set of patterns known as elliott wave. Now there is not much use in Forex of that method of analysis so esteemed in the stock market. I started with all this in the stock market but when I tried the key on currencies it didn't work. Later I found out there was a factor that if you multiply it on all your technicals in stocks they will work in exactly the same way for forex. [Note: exception is my usage of an 89 setting of Williams %R - that does not work with the factor so it should be kept the same for stocks and forex]. The factor is directly related to the key. And the key is always there and is generated by the wave itself. It doesn't get any better than that - to put your analysis right IN the wave.

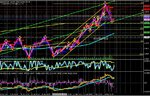
So back to timeframe; its well known that there is always a timeframe governing your trade. Or more correctly stated a Trend. Take any currency and look at a 5 minute - 1 hour - 1 day - and 1 month - all 4 charts tiled on your screen and I will then ask you: "What IS the Trend?"

The trend is your friend. Trade with the trend. Pigs get slaughtered. We traders like our sayings. Well here is the correct answer to the question I posed. There are many concurrent trends depending on the timeframe. It ALL relates to TIMEFRAME. And the ONLY trend that is YOUR friend is the one on which your trade depends.

OK so you already knew there is always a trend governing your trade but how do you determine which timeframe to use? You could get stopped out a thousand times while following one of those sage addages. Reason is is that the trend signals will not change PERCIEVABLY at a main pivot. By main pivot I am refering to one that is an actual trend change on this wave's timeframe.

But get this: the timeframes we all use as standard settings on our charting packages are NOT necessarily the timeframe being used by ANY wave at the moment.

Did anyone ask the wave? (now they think I am losing it)

That is right - a standard technical analysis setting on a standard timeframe may miss the wave's own clock. This is the main problem with many methods. Whatever timeframe you call up... that's where the analysis gets applied, right? So if you hit it by chance let's say and the trades were working for a while but then the trend changes and it doesn't get recognized (remember our secretive robotic friends, the indicators).

It is likely that at that point the analysis which was working will fail for more than half of the following move causing much whipsawing and many stoplosses. This is because each wave has its own timeframe and the new move is on a different one than the last and yet the trader continues to apply his analysis on the former timeframe. Is this possibly the reason oscillators, EA's and Bots (and traders) leave anywhere from 40 - 70% of the super trades on the table? By super trade I mean the total potential from main pivot to main pivot on a given time basis.

I've mentioned a wave's "clock". What exactly is that? Well whatever it is I do know that the wave and consequently the super trade "run" on it. Standard timeframes are NOT the only timeframes there are. There is such a thing as Fibbonacci Timeframes. These things I have described have so much impact on the technical analysis as to render the wrong approach being applied and having an effectiveness of basically useless about half the time.

But this is why I wouldn't touch automated trading at all. Maybe that is the consensus you are getting? Sure are a lot of traders banking on "exotic" / "robotic" indicators/software/EA's.
 
For anyone reading the above post. Note that it seems to be a form letter posted in more than one place on the net and only loosely linked to mp6140's post.

I have edited the signature to comply with T2W requirements. You may draw your own conclusions.
 
:) I stopped reading at the end of the first paragraph when the guy mentioned elliot wave.

That was about enough for me.
 
Top