You are using an out of date browser. It may not display this or other websites correctly.
You should upgrade or use an alternative browser.
You should upgrade or use an alternative browser.
Consistent Break Out Strategy
Hi Everyone,
Before I retire for the day I just wanted to share another set up that occurred today on GBPUSD.
As you can see this was a bull trend. Price then formed a two bar reversal at a resistance zone.
Price then breaks upwards through this zone (taken from high of two bar reversal candle bodies and the shadows)
The break out candle is strong and over 30% of its body past the high of the two bar reversal.
On the next candle after the break out, we see price retract back to the resistance zone, which now forms as support. Entry was at the high of this zone (ideally I'd be looking for price to retract to the low of the zone)
Entry 1.2715
SL 1.2705
TP 1.2725
Winning trade - 10 Pips
foroom lluzers
Veteren member
- Messages
- 3,608
- Likes
- 140
Interesting copyright in your posted photo. So how much do you charge for your indicator again?
Are you using mt4 /mt5?
Interesting copyright in your posted photo. So how much do you charge for your indicator again?
Excuse me I don't have an indicator to sell, nor do I charge, intend to charge or distribute any indicator.
If you read my post you'll see that this strategy is purely Price Action. No indicator I'm aware of could detect or execute such a trading set up, as this requires you the trader to make an analysis of where the price is and what the market is doing.
You'll see that the last picture has "price bands" used, it just so happens that they can from an old indicator I had on MT4. However, spend some time on the charts and look for this set-up. Then you'll see that I'm not selling an indicator!
Thanks
James
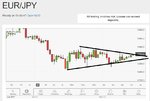
Wedneday 14th June - EURJPY
Good Morning everyone,
A little bit too early in the morning for me, but another example of a break out setup.
As you can see we are clearly in a bull trend (30m Chart).
Price formed a 2 bar reversal with extended shadows, which creates our resistance zone (coloured by blue box).
Price then breaks upwards out of the resistance zone, which then becomes support. Price retracts to the low of the zone, where entry would be placed (123.412).
Though price attempts to push down, it is strongly rejected and we see another 10 pip scalp.

Note: We can see that price previously respected the upward trend line (Denoted in Red) which give us confidence that price will continue to rise. Looking left we can see price action at our Take Profit Level (123.512) which could suggest price could potentially reverse at resistance or break it for a continuation.
Hope that helpful
James
Good Morning everyone,
A little bit too early in the morning for me, but another example of a break out setup.
As you can see we are clearly in a bull trend (30m Chart).
Price formed a 2 bar reversal with extended shadows, which creates our resistance zone (coloured by blue box).
Price then breaks upwards out of the resistance zone, which then becomes support. Price retracts to the low of the zone, where entry would be placed (123.412).
Though price attempts to push down, it is strongly rejected and we see another 10 pip scalp.
Note: We can see that price previously respected the upward trend line (Denoted in Red) which give us confidence that price will continue to rise. Looking left we can see price action at our Take Profit Level (123.512) which could suggest price could potentially reverse at resistance or break it for a continuation.
Hope that helpful
James
Last edited:
foroom lluzers
Veteren member
- Messages
- 3,608
- Likes
- 140
Good Morning everyone,
A little bit too early in the morning for me, but another example of a break out setup.
As you can see we are clearly in a bull trend (30m Chart).
Price formed a 2 bar reversal with extended shadows, which creates our resistance zone (coloured by blue box).
Price then breaks upwards out of the resistance zone, which then becomes support. Price retracts to the low of the zone, where entry would be placed (123.412).
Though price attempts to push down, it is strongly rejected and we see another 10 pip scalp.
View attachment 241128
Note: We can see that price previously respected the upward trend line (Denoted in Red) which give us confidence that price will continue to rise. Looking left we can see price action at our Take Profit Level (123.512) which could suggest price could potentially reverse at resistance or break it for a continuation.
Hope that helpful
James
ok I am the blind
Attachments
ok I am the blind
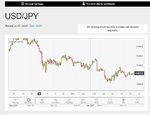
Thats a 4hr chart, my analysis is from the 30m chart.
foroom lluzers
Veteren member
- Messages
- 3,608
- Likes
- 140
Thats a 4hr chart, my analysis is from the 30m chart.
why not buy usd jpy
Attachments
foroom lluzers
Veteren member
- Messages
- 3,608
- Likes
- 140
I think you should follow these rules ,in these thread before picking trades.The trade here should be USD JPY imho.
http://www.trade2win.com/boards/edu...h-probability-trading-system-75-hit-rate.html
http://www.trade2win.com/boards/edu...h-probability-trading-system-75-hit-rate.html
Attachments
foroom lluzers
Veteren member
- Messages
- 3,608
- Likes
- 140
Look , you come here and preach the blind , but you are blind to this trade yourself.
Hire a real mentor ,teaching you the wrong way.😆😆
You are more than welcome to your "subjective" if not blatantly inept judgement.
If a particular strategy work, and is low risk please explain how I am "Preaching" that anyone uses it.
I have not told anyone to trade this way, I am simply demonstrating a method that is very consistent and has been traded many times. All of the trades that I have displayed have won, using the very same conditions produced by the Market.
I'm not quite sure why you feel that you find it necessary to attack this thread with no substance of benefit to this Forum or the people that use it?
If you don't wish to trade this strategy then don't there are plenty of ways to trade. However, you won't find me slandering other people or strategies.
I thank you for having an opinion but it is clear to me that you do not understand this strategy, nor have you applied it.
When you have, and can offer valid analysis on this particular strategy, lets say 1000 trades to add weight to your comments, then perhaps we can have a civilised conversation, then might have a positive outcome.
I will be removing your comments from this thread as they do not offer any benefit to anyone.
Regards
James
Consistent Break Out Strategy - Gold 14/6/2017
Hi All,
This BO trade just took place on Gold (12:30 BST). Another 10 Pips secured.
A large bear sentiment drove through the support zone, price then retracted to the zone before dropping to the downside.

Minimal risk SL and TP. 20 pips secured today. I'm out of the Market while key FOMC speeches rumble on! Dovish or Hawkish! My source say's Short on EURUSD. Lets see how that assessment pans out!
Kind regards
James
Hi All,
This BO trade just took place on Gold (12:30 BST). Another 10 Pips secured.
A large bear sentiment drove through the support zone, price then retracted to the zone before dropping to the downside.
Minimal risk SL and TP. 20 pips secured today. I'm out of the Market while key FOMC speeches rumble on! Dovish or Hawkish! My source say's Short on EURUSD. Lets see how that assessment pans out!
Kind regards
James
Excuse me I don't have an indicator to sell, nor do I charge, intend to charge or distribute any indicator.
Good. I will reserve judgement until I have had a chance to properly evaluate what you are doing then. Just didn't want to waste my time.
Good. I will reserve judgement until I have had a chance to properly evaluate what you are doing then. Just didn't want to waste my time.
You are free to choose to make any judgement you do so wish.
Another 10 Pips
Trade taken from AUDUSD today.
In the down trend we see a two bar reversal. Followed by a strong bear candle breaking through the support zone. Price gives us a perfect retraction to entry at 0.75848.
Just over an hour past entry we take profit at 0.75748. Concluding another successful scalp.
Patience is the key with this strategy and I follow the rules of entry precisely.
I do not over trade because this Price Action strategy does not occur every five minutes. Not do I have indicators that give "false signals". There are valid loses and that the loss was unavoidable. However, risk is limited and you should control your money management.
So far this week 17 set ups that have been captured have all been successful. So I will continue posting trades that I've taken, so that others can see the consistency in how I trade.
Good luck
James
James, I have taken a stab at trying to understand your system. In order to do so I looked at your posted charts and tried to annotate all of the criteria that need to occur to validate entry. Any pointers you could give would be appreciated as I am trying to understand your system. I am sure I will have more questions later on but for now:
One item that I am having a difficult time with is, how do you define a 2 bar reversal? Are you simply looking for one bullish and one bearish candle that have either a similar high or similar low right next to each others? If so, how far off are these two candles high or low permitted to be before it is not considered a 2 bar reversal. I have tried to define that on the charts I have annotated below, let me know if I got it wrong please.
Another question related to the two bar reversal: are you only looking for price to break in a certain direction from the reversal? I am thinking not, but am not real sure which may be why I am having a hard time understanding how you are defining a 2 bar reversal. Also, is there a minimum candle size you are looking for with these reversals or not really?
Also, I am a little fuzzy on how you are defining your support/resistance zones. I think you are defining it as the shadows of the 2 bar reversal, but in the first chart you posted it appears you are using more than this to define the zone. For that one I believe a valid entry signal would be generated, but the price would not retrace back into the zone so the trade wouldn't have been taken. A little more clarity on this would be appreciated.
As another point. It looks like you are requiring the breakout candle to travel through the entirety of the support or resistance zone in addition to having > 30% beyond it. Is this correct?
One last thought of mine from looking at these. It appears you use a bit of discretion on your entries. You have indicated that entering at the bottom of the zone is preferred, but a lot of the time if this was done the trade would be missed. For my chart annotations I have just assumed entry upon breaching the zone after breakout.
AUDUSD from 06/12/2017

If the resistance zone is defined by the two bar reversal shadows only then entry into this trade would not have occurred since the shadow on the bullish bar in the reversal at top is minimal --> maybe I do not have the 2 bar reversal defined correctly in this one?
Also would the second signal have been valid, just no entry since no price retrace?
EURUSD from 06/12/2017

Do I have the 2 bar reversal defined correctly in this one?
GBPUSD from 06/13/2017

Do I have the 2 bar reversal defined correctly in this one?
USDCHF from 06/13/2017

Do I have the 2 - 2 bar reversals defined correctly in this one?
AUDUSD from 06/15/2017

Do I have the 2 bar reversal defined correctly in this one?
Thanks!
JordanSchleider
Newbie
- Messages
- 2
- Likes
- 1
Thanks for sharing your experience. I am new here and I have found a lot of valuable information here on trading.
Similar threads
- Replies
- 10
- Views
- 4K
- Replies
- 10
- Views
- 6K