ATK Atkins WS PLC

Messages
549
Likes
2
Just a quick note further to my posting on the accumulation swing index.

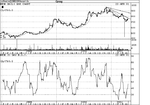
I have noticed that ATK has made a breakout on the accumulation swing index and is testing long term resistance. Interestingly the price chart has *NOT* yet broken out though there seems to be an increasing volume trend.

I will be watching this closely but are there any views on this?
 
On second thoughts I may have a data problem here!

Looking at the chart using candles there is a crazy low open value on 28/03/2001 which seems to have affected the swing index calculation.

Oh well.
 
Hi Darth
I'm not to sure, could be one to watch. If you had used 28 day MA you would have been up 22.55%. In the next few days we might see a break above resistance.
Thanks for pointing this one out.
Good luck
Greg.
P.S
only my thoughts
 

Attachments

  • payneg016.gif
    payneg016.gif
    12.8 KB · Views: 375
Just to add, this share has a major support level at around 743-long wide upward channel.The price has recently performed a head and shoulders patern around this support level and is moving up in its current downtrend channel-resistance levels can be found at 801 and 814, with the rsi showing a double bottom patern-higher low also and the short term MA's turning up and looking as if they will cross, in my view there is upside to this share short term.Stop to be put in place at long term support level-higher if this % stop to high .
 
Chart still looking positive.
This one still moving up nicely and possibly more to come, worth adjusting stop loss now.Price breakout of downward channel and indicators looking good.
Sector, positive news with WSP expanding opperations in the US.
 
Agreed Sharky.Down trend and horizontal trend broken.There was positive divergence on Velocity (11) before the breakout.Positive divergence on velocity on the last trend breakout too. Watch for resistance at 828,850,870,890 then 920.
 
This thread has gone quiet, but not the stock, still looking good from an end of day chart perspective and now you can be confident on a longer time frame.The weekly chart has now performed a head and shoulders patern near to the strong support level, this is an exellent reversal patern and I expect the price to now run up to its upward channel resistance at around the £10 mark in time.
Indicators still showing on the positive side and the stock looks like a nice buy and hold at present.


Sparky
 
a nice strong move today on volume.
Interestingly I think one of the analysts on Bloomberg had this as a sell over the weekend.
 
Top