Ask ANY trading related question!

Status
Not open for further replies.
Advice please

Hi,
I have attended a 'Traders University' seminar and provisionally booked a course. Has anyone been on one and can you recommend or otherwise?
 
Hi,
I have attended a 'Traders University' seminar and provisionally booked a course. Has anyone been on one and can you recommend or otherwise?
Hi Graham,
Welcome to T2W.
The subject of seminars, courses and coaches is both longstanding and highly contentious here on T2W. Some vendors attract more heated debate than others and, it must be said, Traders University is right up there with the best of 'em! That's NOT to say you shouldn't attend the course (forgive the double negative), but do your homework before you start signing cheques. Have a good look through the forum linked below and familiarize yourself with the various arguments - for and against.
Seminars & Tutors - T2W Day Trading & Forex Forums
Ultimately, if you do decide to go for it, you need to be completely convinced of one important thing; namely, that the seminar will yield priceless information, ideas, techniques, help and support etc. that you won't find for free here on these boards. If you're in any doubt about this, you could always pose this question to Traders University and post their reply on T2W to see if it stands up to the scrutiny of the membership.
Tim.
 
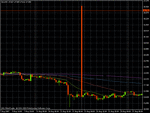
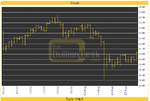
hi,i keep seeing big spikes in price like the one in the 4h silver chart iv posted,this one seemed to happen over the weekend as i cant see anything on the hourly but they also happen during the trading day.i was hoping somebody could explain a bit about these wild spikes ,do they really happen or are they a platform thing?? thanks in advance:?:
 

Attachments

  • ggggg.gif
    ggggg.gif
    17.4 KB · Views: 156
It looks like an aberration in your charting data
.
 

Attachments

  • silver.png
    silver.png
    5 KB · Views: 143
  • silver2.png
    silver2.png
    30.4 KB · Views: 128
Just joined your forum

Hi all,
I have just joined the forum, and am a complete fresher and keen to learn with you experienced lot.
Peter
 
It looks like an aberration in your charting data.
Or . . .
another explanation is a trade going through away from the current bid / ask, e.g a deal between two MM's. To confirm, drill down to a 1 minute chart and you should see the same spike just as it appears on the longer timeframes. If not - and there are 'normal' bars / candles trading up to the top / bottom of the spike and then back down / up again - then this doesn't apply. In this case, as nine suggests, it's probably caused by rogue data.
Tim.
 
Hi all,
I have just joined the forum, and am a complete fresher and keen to learn with you experienced lot.
Peter

WELCOME PETER --- now be silent and READ

after you are SO CONFUSED that you havent a clue and know it, ask questions and they shall be answered !

said with tongue in cheek, but also a hell of a lot of seriousness behind it !

mp
 
Scale IN vs Scale out, and throw in no scaling too...

Scale in: Your biggest risk is at trade initiation, so why not start with your smallest lot exposure, and scale into your position as the underlying goes in your favor. The question here is: At what points do you scale in (1/3 initial, 1/3 @ 1ATR, 1/3 @ 2ATR; or, 1/2 initial and 1/2 @ 1ATR, etc)? And, when do you pull along your stops? At 1ATR, bring to BE, and when underlying at 2ATR bring to 1BE? This method, should, by far, give the biggest profit?

Scale Out: Why put on your most shares at the beginning of the trade, when you have most at risk? Anyway, suppose you did do this method... It should give you a higher Win/Loss ratio, lower DD than the other two methods, but also much less profit. Psychologically comforting, so to speak...But how/where would you scale out? Put full amount at launch of trade, take 1/3 off at 1ATR. take another 1/3 off at 2ATR, and let the last 1/3 ride? The initial stop would be at, say, some value below support (if going up), or some ATR multiple (say 1.5), then when the trade goes in your favor to 1ATR, you peel off 1/3 of your position, and pull your stop to BE, then when the trade gets to 2ATR, pull off another 1/3, and move your stop to 1ATR, then let the last third ride, with a, say, 1.5 ATR trailing stop?

All in-All out: You go all-in at the beginning, and, say, place your stop slightly below support, the previous bar low, 1.5 ATR,etc, and when the trade gets to, say, 1 ATR, you bring your stop to BE. From then on out you either trail with a, say, 1.5 ATR stop, look for overhead resistance (whole numbers, previous resistance) and potentially get out, or sense a momentum shift, and get out. This has a lower w/l compared to scaling out, higher DD, but more profits, depending on market condition (range bound or trending), and how you place your stops.

When I look at Harvey Walsh's YouTube videos, for example, he scales out, but yet all of his remaining scaled portions were winners! This proves the point to him, or it should, that scaling out was NOT the correct thing to do. He should have merely gone all-in and all-out...he would have made a lot more money each trading day he shows.

What do you think?

JohnYoga
 
Or . . .
another explanation is a trade going through away from the current bid / ask, e.g a deal between two MM's. To confirm, drill down to a 1 minute chart and you should see the same spike just as it appears on the longer timeframes. If not - and there are 'normal' bars / candles trading up to the top / bottom of the spike and then back down / up again - then this doesn't apply. In this case, as nine suggests, it's probably caused by rogue data.
Tim.

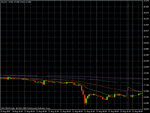
hi there,this is what it looks like on the hourly(cant break it down any more)ands it a strange sight!the bars are scaled down as if the spike has occured but it isnt shown??!!as soon as the chart moves past the weekend the correct scale returns?
jus wondering if this happened on a real account ,would i be able to trade it?? it once hapened on my demo and i made a bunch of pips in about 1 min!!real move or bad data...?could it be profitable??
by the way thanks for your responces:cool:
 

Attachments

  • eeeeeeeeeeee.gif
    eeeeeeeeeeee.gif
    15.6 KB · Views: 147
R2/R3 trading method

Hello,

I am new to these forums. I have been researching the R2 trading method and I was wondering does anyone have any info on the R3 / R4 trading method. I believe it is a derivitive of the R2 in which you wait for the markets 2 period RSI to fall below 65 and then continue lower for three days. It seems very affective looking at the back testing data. I am wondering if the R3 / R4 method would work on individual stocks. Any info is appreciated. Thanks.

bslater
 
MP -- funny, i "invented" that !

Hello,

I am new to these forums. I have been researching the R2 trading method and I was wondering does anyone have any info on the R3 / R4 trading method. I believe it is a derivitive of the R2 in which you wait for the markets 2 period RSI to fall below 65 and then continue lower for three days. It seems very affective looking at the back testing data. I am wondering if the R3 / R4 method would work on individual stocks. Any info is appreciated. Thanks.

bslater

there is also the usage of that method, buying when the RS1 falls below a value of (1) and then starts back up. I know a little about this method as i "invented" what youre speaking of about 7 years ago. (not the RSI 2, as thats part of "muddys" technique, and the RSI 2 under the value of (1) i originally saw presented by "the rumpled one", but the number of days, the values and usages were presented by me in a rather detailed method, which interestingly is patented and more interestingly not being obeyed !

oh yeah, originally it was made for stock trading with forex being a rather late usage !

oh well

mp
 
R3/R4 system

mp6140,

Do you offer any rules to trade the R3 / R4 system, I mean have you published them anywhere?. Is it similar to the R2? I like the R2 I just wish I could find a system that generated more signals. I would really like to know more about your system. I can not day trade, however I am able to trade each morning and everning. Is this a system that would be effective for me? Thanks again.

bslater
 
Hi there everyone my name is Anthony and I am new here- just a quick one I have an 'assessment meeting' coming up next Tuesday for I guess what you could call a futures proprietary trader. I was wondering has anyone been to this sort of meeting before and what questions will be asked and does anyone have any general advice about futures trading? Really appreciate any feedback on this as I feel I could flounder at the next step!!! Thanks very much Ant :)
 
Hello,

I've been testing some EAs in a DEMO Account from MetaTrader4, and it works pretty well, now im testing in a DEMO Account from Interbank, and what I would like to know is: The DEMO Account is the SAME of the REAL MONEY Account, except, of course, about the money? Ex.: If my EAs trade and make it good on a DEMO Account they will do it good on a REAL $$ Account?

Many Thanks,

Fbhz85
 
mp6140,

Do you offer any rules to trade the R3 / R4 system, I mean have you published them anywhere?. Is it similar to the R2? I like the R2 I just wish I could find a system that generated more signals. I would really like to know more about your system. I can not day trade, however I am able to trade each morning and everning. Is this a system that would be effective for me? Thanks again.

bslater

=========================================================================

go to "stockfetcher.com", the yahoo group and not the charting service and in the archives you will find a lot of information by "the rumpled one" who went into great detail on the R2 system --- this is from years ago when we were fooling with the idea.

you can also go to "stockhideout.com" and look up "the freebie", which is my method released 7 years ago or so (it may also be under "mikeys method" which we also used)

if that fails, get back in touch

mp
 
R3 R4 trading method

=========================================================================
MP6140,

Sorry, I went through those sites and found plenty on the RSI2 but I could not find the info on how I described it in my first post. Would the R3 and R4 be waiting for the 3 and 4 period RSI to fall below 65 and then continue lower for three days before buying, hence would the rules or screen be the same as the RSI2 I descibed above except just change the RSI period to 3 or 4. I appreciate your patience. I assume you are saying that you came up with the R3 / R4 method that trading markets sells. I have heard read good things about the system and if you got screwed I am sorry. I was just hoping to get the rules. Thanks again.


go to "stockfetcher.com", the yahoo group and not the charting service and in the archives you will find a lot of information by "the rumpled one" who went into great detail on the R2 system --- this is from years ago when we were fooling with the idea.

you can also go to "stockhideout.com" and look up "the freebie", which is my method released 7 years ago or so (it may also be under "mikeys method" which we also used)

if that fails, get back in touch.

mp6140,

I'm sorry I checked those sites out but I couldn't find the RSI2 in the context I am talking about. The stuff I found was on the RSI2 being below one and the stock trading 10% below the day before. I was refering to the RSI2 trading below 65 for three consecutive days (lower each day). It sounds like you got %&?!@% on the R3/R4 method that tradingmarkets touts. I am sorry for that. I was just hoping to get the rules for your R3/R4 method since I have read good things about it. I appreciate your patience.

bslater
 
Totaly new to trading and am just trying to get a feel for it. I recently got some bumph about something called "Foolproof Earlybird Forex Trading System". Has anyone heard of it? Is it worth going down a route like this, or is it just a mug's game to extract wealth from noob's like me?
 
Status
Not open for further replies.
Top