If moving averages are hurting your trading or investing performance and getting you below average results, it’s because that’s exactly what they are designed to do. They are a very popular tool for novice retail traders and investors yet hardly used or thought about by the professional trader/investor. Helping you understand this is the focus of this piece.
Instead of going through many charts to find the perfect picture to use as an example to illustrate my logic, I like to use real trades as examples from our live trading rooms.
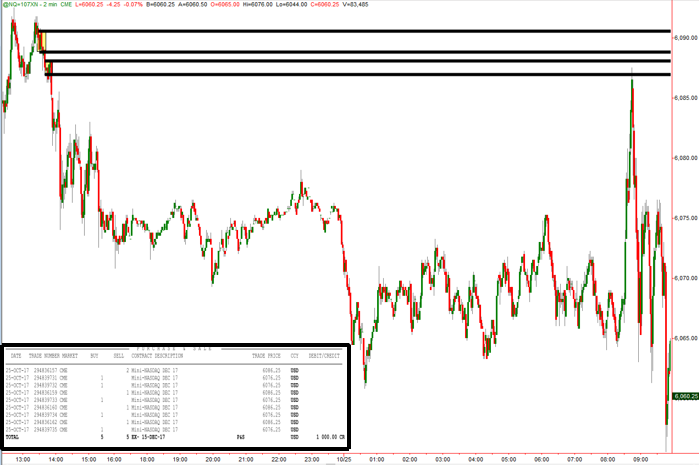
Below is a trade I took in the NASDAQ futures. We identified 2 strong supply zones where banks were selling that morning as seen on the chart below. When price rallied and reached the supply zones, I shorted the NASDAQ and profited ($1,000) as price fell. These were 2 strong supply zones on top of each other and there was a clear profit zone below. Notice the only information I used to make decisions was PRICE, nothing else. No tools, news, opinions, indicators and so on… Price is the only thing that shows me the objective picture of real time supply and demand in any and all markets.
Sam Seiden Live Trading Room Trade 25th Nov 2017: NASDAQ Short – NO Moving Average

Fig 1
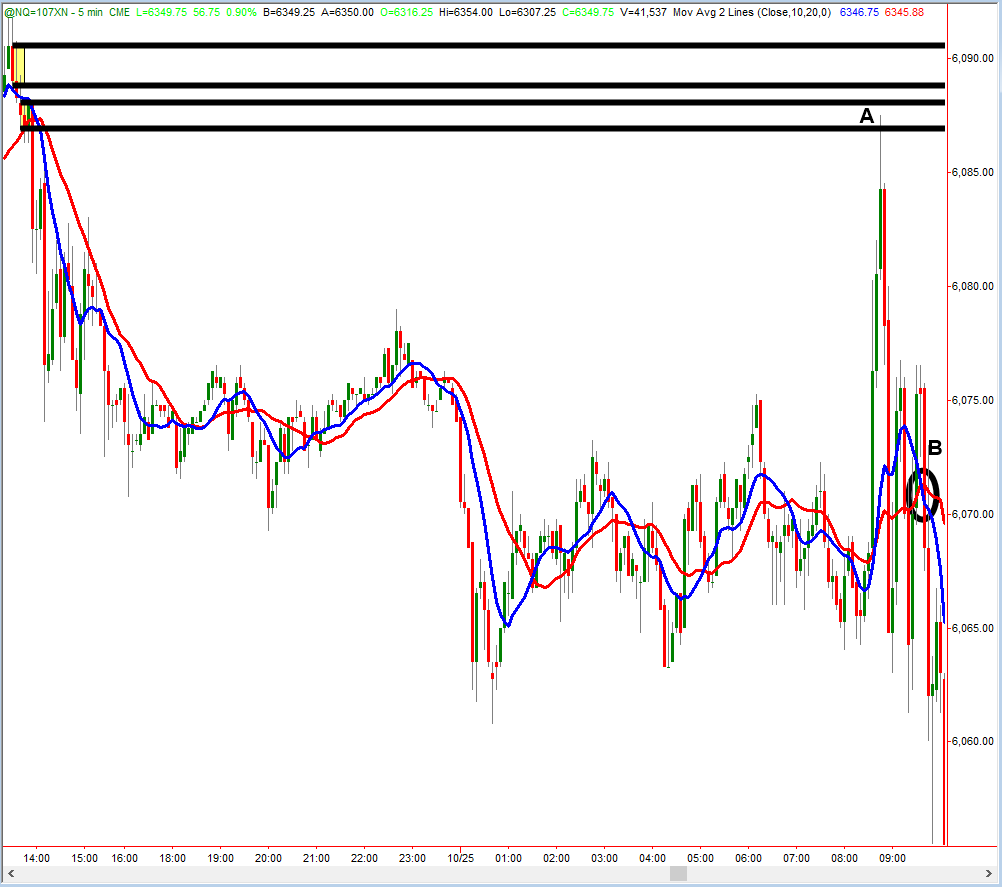
Now let’s look at the same trading opportunity again, only this time let’s add one of the most popular trading/investing tools in existence, the Moving Average. Most people use 2 moving averages and when they cross, that is a buy or sell signal according to the rules laid out in almost every trading book ever written. For shorting, when the fast-moving average (blue line) crosses the slow-moving average (red line), that is the sell signal for those who use this tool.
Sam Seiden Live Trading Room Trade 25th Nov 2017: NASDAQ Short – WITH Moving Average

Fig 2
“A” represents price at the supply zone where I shorted. Below and to the right, “B” represents the moving average cross that is the sell signal for those using moving averages. What this clearly shows is the vast difference in the price when using moving averages to select your entry point vs. using price. Meaning, using a moving average to enter this or any trade ensures you will not sell at supply (retail prices) or buy at demand (wholesale prices). You will instead sell much lower, losing profit potential. This, of course, is because moving averages lag price; that’s what they do/are.
Adding anything to your decision-making process that lags price only increases risk and decreases reward. Selling at supply (retail) and buying at demand (wholesale) ensures the lowest risk, highest reward and highest probability trading/investing opportunity.
Now think about how you successfully buy and sell things in any other part of life. You would never use a moving average because on the one side you would pay too much and on the other you would hardly ever make money. Those on the other side of your transaction would love you of course, but that’s not the goal. To think that a decision-making tool that lags price will help you buy low and sell high is very flawed thinking and you can’t win in trading if your losing in your mind. Many of the traders following indicators such as moving averages are really smart people who have the best of intentions, they’ve just been taught incorrectly.
Again, there are so many books on trading and investing and millions of lessons on the internet, yet the vast majority of traders and investors fail when it comes to achieving their financial goals. Conventional technical and fundamental analysis is a lagging school of thought that leads to high risk, low reward and low probability trading and investing. All indicators are simply a derivative of price, meaning they lag price. By the time they tell you to buy or sell, the low risk, high reward opportunity has passed. Think about it, most people take the same buy and sell action and most people don’t achieve the success they need to live the life they choose. Maybe they should stop and consider how flawed the logic is in that conventional thinking and action.
My goal in this piece is not to beat up books and theories, it is simply to open your mind to a lower risk, higher reward way of trading and investing to ultimately achieve financial freedom and live life on your terms.
Sam Seiden can be contacted by email on this link: Sam Seiden
Instead of going through many charts to find the perfect picture to use as an example to illustrate my logic, I like to use real trades as examples from our live trading rooms.
Below is a trade I took in the NASDAQ futures. We identified 2 strong supply zones where banks were selling that morning as seen on the chart below. When price rallied and reached the supply zones, I shorted the NASDAQ and profited ($1,000) as price fell. These were 2 strong supply zones on top of each other and there was a clear profit zone below. Notice the only information I used to make decisions was PRICE, nothing else. No tools, news, opinions, indicators and so on… Price is the only thing that shows me the objective picture of real time supply and demand in any and all markets.
Sam Seiden Live Trading Room Trade 25th Nov 2017: NASDAQ Short – NO Moving Average

Fig 1
Now let’s look at the same trading opportunity again, only this time let’s add one of the most popular trading/investing tools in existence, the Moving Average. Most people use 2 moving averages and when they cross, that is a buy or sell signal according to the rules laid out in almost every trading book ever written. For shorting, when the fast-moving average (blue line) crosses the slow-moving average (red line), that is the sell signal for those who use this tool.
Sam Seiden Live Trading Room Trade 25th Nov 2017: NASDAQ Short – WITH Moving Average

Fig 2
“A” represents price at the supply zone where I shorted. Below and to the right, “B” represents the moving average cross that is the sell signal for those using moving averages. What this clearly shows is the vast difference in the price when using moving averages to select your entry point vs. using price. Meaning, using a moving average to enter this or any trade ensures you will not sell at supply (retail prices) or buy at demand (wholesale prices). You will instead sell much lower, losing profit potential. This, of course, is because moving averages lag price; that’s what they do/are.
Adding anything to your decision-making process that lags price only increases risk and decreases reward. Selling at supply (retail) and buying at demand (wholesale) ensures the lowest risk, highest reward and highest probability trading/investing opportunity.
Now think about how you successfully buy and sell things in any other part of life. You would never use a moving average because on the one side you would pay too much and on the other you would hardly ever make money. Those on the other side of your transaction would love you of course, but that’s not the goal. To think that a decision-making tool that lags price will help you buy low and sell high is very flawed thinking and you can’t win in trading if your losing in your mind. Many of the traders following indicators such as moving averages are really smart people who have the best of intentions, they’ve just been taught incorrectly.
Again, there are so many books on trading and investing and millions of lessons on the internet, yet the vast majority of traders and investors fail when it comes to achieving their financial goals. Conventional technical and fundamental analysis is a lagging school of thought that leads to high risk, low reward and low probability trading and investing. All indicators are simply a derivative of price, meaning they lag price. By the time they tell you to buy or sell, the low risk, high reward opportunity has passed. Think about it, most people take the same buy and sell action and most people don’t achieve the success they need to live the life they choose. Maybe they should stop and consider how flawed the logic is in that conventional thinking and action.
My goal in this piece is not to beat up books and theories, it is simply to open your mind to a lower risk, higher reward way of trading and investing to ultimately achieve financial freedom and live life on your terms.
Sam Seiden can be contacted by email on this link: Sam Seiden
Last edited by a moderator:
