hereward the wake
Senior member
- Messages
- 3,154
- Likes
- 124
Yes - based on last two weeks what I have learned, I would have different approach to my trading now. I haven't paid much attention to indicators as much as should. I started to try them out lately within learning trendlines. Now I also have better understanding when been following this thread and learning from you guys.
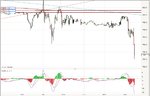
At the moment I'm trying out Williams% and RSI both together. What do you think about them?
I couldn't find Ema on my Mt4, does it have another name? is this a good description http://www.investopedia.com/terms/e/ema.asp It's suggesting that it would be good to use Ema together with Sma? those numbers are unfamiliar at the moment for me ^^
and thanks for the Demark-link, I'll read it through.
I don't use any indicators, just ema (exponential moving average) Mt4 will have them. Sma simple moving average, they do of course lag the price action but they are a good visual reminder of change when they cross. Get a good working knowledge of candles and price action google them there is a ton of stuff out there.
De Mark is very good on Tls draw form right to left very accurate, I use a 4hour TF to draw lines and a 1 hour chart for entries.