barjon
Legendary member
- Messages
- 10,752
- Likes
- 1,863
wow hadn't noticed bj....so where do i close? just monitor each hour or since it's longer term do i use 4hr?
well you're about +38 net now - ain't that good enough 😆
wow hadn't noticed bj....so where do i close? just monitor each hour or since it's longer term do i use 4hr?
well you're about +38 net now - ain't that good enough 😆
ok it's closed :clap:
ftse has been really strong this am - by noon it was +50 vs dow - must be ensuring a decent quarter end.
the way to play it, dl, when you reckon the strength is running out of steam is to close the dow short first - assuming you see ftse up likely to continue - and then take a bonus if ftse keeps on going, or run quickly if it doesn't.
Wallstreet's turn to paint the quarter end. ftse gone -20 weak over last couple of hours. Timing spot on, DL 😆
..............ftse has been really strong this am - by noon it was +50 vs dow ..............
- and from there it traded -39 weak into the close. Should've had that if I'd had my wits about me.
Enjoy the break guys 🙂
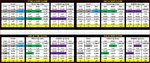
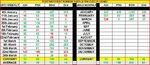
Started to collect the weekly and monthly point movement in the markets attached.
Lee Shepherd gave me the idea on something he posted.
The data is still very raw at this early stage, but should gain more strength the longer the data is collected.
Want to start to hold some trade's over longer periods and hopefully this will give some idea of the points movement over a monthly or weekly period.
My current trade's are 24 hours or less.
PS Will post 2013 numbers over the weekend.
Guys why not get a chart for this thing ? I recall with prorealtime you can get a customized chart for any spread you want .
aye, but personally i find numbers more powerful.
gonna freeze to death with some golf now
Guys why not get a chart for this thing ? I recall with prorealtime you can get a customized chart for any spread you want .