Anyone scalping the FTSE Futures??

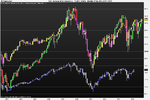
morning Splitlink take a look at the year chart of Dow its a massive inverse head shoulders

Great chart.Down before up though?

How about some more ramping.

On the FTSE - weekly.
v7fu4x.png

There is also a slanted IHS on the daily - and the 5650 low appears to have been a retest of the neckline.
 
i min chart could say wave three down now but could also say wave 5 up...i think

It's very messy so I've moved up to the 3 min. looks like wave 1 finished wave 3 next. Not had a 61% correction so perhaps it's coming later, perhaps.

Still 'in' - reverse at 5781 could be bullish sign?
 
It's very messy so I've moved up to the 3 min. looks like wave 1 finished wave 3 next. Not had a 61% correction so perhaps it's coming later, perhaps.

Still 'in' - reverse at 5781 could be bullish sign?

if wave 2 finished at 10;42 5795 3 min chart was that not a 61ish? how do we measure wave three target? just to confuse things if we ignore this mornings down move we are now on wave 2 up

think nfp will screw it all up anyway et:confused:
 
a fx company is making a special offer, trade risk free for 30days, they eat any losses u keep any profits can this be too good to be true.

I would read the small print ;)

There will definitely be something in there like: you must invest x amount, be active, can only trade x amount - etc. etc.
 
Dow yellow purple
dax green red
ftse blue grey
 

Attachments

  • DOW DAX FTSE.png
    DOW DAX FTSE.png
    20.8 KB · Views: 121
if wave 2 finished at 10;42 5795 3 min chart was that not a 61ish? how do we measure wave three target? just to confuse things if we ignore this mornings down move we are now on wave 2 up

think nfp will screw it all up anyway et:confused:

If you mean 10:52, looks like just over 38% on my chart. currently calling those zig-zags. if I'm right that wave 3 has yet to occur maybe it will take us over 5781, or that will be the price where it temporarily reverses before wave 5.

Still bearish for now despite this latest up tick.
 
Now 5 min chart looks like cup and handle. We had a really volatile range yesterday about this time before a sharp up move. In that case, beware the spike down to 5781.
 
If you mean 10:52, looks like just over 38% on my chart. currently calling those zig-zags. if I'm right that wave 3 has yet to occur maybe it will take us over 5781, or that will be the price where it temporarily reverses before wave 5.

Still bearish for now despite this latest up tick.

my 3 min chart
 

Attachments

  • 3min.gif
    3min.gif
    25.1 KB · Views: 130
struggling around yesterdays daily high

does eliot wave come to a conclusion, a direction a place to go long or a place to short? is anything decided?

some times it works some time it dont ....the C wave +BJ10 was a good combination this morning :)

et has a far better understanding than me 12345/ABC that's as far as i go
 
some times it works some time it dont ....the C wave +BJ10 was a good combination this morning :)

et has a far better understanding than me 12345/ABC that's as far as i go

this is excellent. i happen to know that "wavers" tend to be the top performers in trading competitions.
 
my 3 min chart

We got a rejection around 61% for a Wave 1. It does now look like a bullish cup and handle. Appears not to originate from a good S/R level. A reminder nothing ever plans out exactly how you think.

Right now I don't know what is happening so I'll just take the chart as it is - bullish - and not project ahead as I'm now getting confused.

I think the main thing that confused me was calling a HS top, when it was a HS-like formation in a range.
 
Top