Anyone scalping the FTSE Futures??

:LOL:lets make it interesting if we hit 208 circa 1:40 +/-10 I open the beans, if not beans in cupboard

Looks like it's no beans for us!

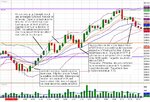
I do get your point about the price level coming from the high at 9:40am. I don't always look for a Gartley pattern, and maybe I should do more often.
 
well this is interesting not much on the table so far if the DOW goes 289 to329 into open Im gonna have to short

as I type
 
I will do something any day soon


just been scalping the DOW what a horrible way to trade
 
need the last half hour to be a downward movement this will confirm pattern and target @339
 
I agree. Who would want to scalp the Dow this afternoon.

As for price action on the FTSE, it was relatively clean this afternoon and gave two nice clear reversals. One just after the open at 14:35 and the other off a resistance level at 15:11. I expect price action to get a little messier until the run in after 4pm.
 

Attachments

  • 7 Sept 2011 us opening session.JPG
    7 Sept 2011 us opening session.JPG
    204.5 KB · Views: 166
I use S/R levels lots to determine price targets and areas where price will bounce. But there are times when the FTSE just bounces off nothing, and you are left scratching your head as to why it turned where it did. This morning the FTSE did that at 11:20am.

It was in a downtrend and the next level down was at 5223.5 which it should have reached but it reversed off 5233.5, 10 pts higher. It pays to watch the ES as well, because it clearly bounced off the 1172.0 level at the same time the FTSE reversed.

Now I don't expect ES levels to be quite so important in the first hour of trading 8am to 9am, but late morning it is worth seeing the influence of the US market coming in to play.

Hopefully you can see it clearly on the attched charts.

Martin

I'm not sure why it wasn't lower before it turned but I think it was tracking the Dow as that wasn't allowed to go below 11200 when it reversed.

PS Sorry I know it's a bit late but I have only just looked at this thread
 
Last edited:
so they sold into close
gap down in morning buy it back up to the 339 level then sell into afternoon sounds like a plan to me
actually sounds like dejavu from last week
 
Martin, your scalping method is very, very similar to mine. I enter on break of the retracement candles, with a stop just underneath the candle. If price moves 55 pc back inside the candle I remove half my position and leave the rest to run to stop. However if it breaks again , I add it back in. I use 1 min charts, and like to see the price on the 5 minute chart above the 20ema for a long , under for short. In addition , I will reverse and fade a move if I judge it has moved too quickly, too far, or if I believe they have squeezed through a key price.
 
martin is that a free chart software ? someone was asking on this board for free charting the last one I remember was sierra chart with IB feed
 
As for DC's targets of 5461 for FTSE cash and 11898 for the Dow, I have no idea how or why we will get a rally up to those levels (I am very bearish), but DC has a great track record and reads these moves better than someone with a time machine.

my guess is right now you thinkin Mmmm
 
DC's target does look in sight though doesn't it?? I cannot see the technical logic in the FTSE cash (but I am not a technical expert I have to say) ---- However, I can see a logic in the Sept futures contract. a) the fib from 22/7 swing high to 8/9 low shows 5461 as the 61.8% retracement. b) it coincides with the top of the channel of the current pattern we are in.

A wild stab in the dark??? I dont know, will let others and time judge
 
martin is that a free chart software ? someone was asking on this board for free charting the last one I remember was sierra chart with IB feed

DC - The charts I use are provided by my brokers Open ECry. You can open a demo account for free for 2 weeks after that I think they charge $50 per month. If you fund an account, you get the demo platform for free. They only provide futures charts and not cash charts, but the great thing is you don't pay for a data feed and you can trade and chart anything from FTSE to Gold to Oil to Dow to etc....

If you want live free charts you can use any of the following:

Forex Charts | Free Forex Charts | Real Time Forex Charts

Forex Charts | Currency Charts

FreeStockCharts.com - Web's Best Streaming Realtime Stock Charts - Free
 
Martin, your scalping method is very, very similar to mine. I enter on break of the retracement candles, with a stop just underneath the candle. If price moves 55 pc back inside the candle I remove half my position and leave the rest to run to stop. However if it breaks again , I add it back in. I use 1 min charts, and like to see the price on the 5 minute chart above the 20ema for a long , under for short. In addition , I will reverse and fade a move if I judge it has moved too quickly, too far, or if I believe they have squeezed through a key price.

DJ and Lurkalot - I will reply when I have more time tomorrow. Mrs C-J says its time to turn off the computer. It's been a long day.
 
Top