Chalky_trader
Well-known member
- Messages
- 463
- Likes
- 34
In Novemeber?!
😱
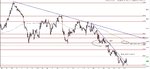
expect 5350 to be retested at some point:
I thought hat this was a scalpers thread 😱
that chart is over six months in timeframe 😢
In Novemeber?!
😱
expect 5350 to be retested at some point:
I thought hat this was a scalpers thread 😱
that chart is over six months in timeframe 😢
probably won;t leave either - the afternoon market are eating turkey instead.
my first trade today I had to move smartly
caus the 10 min chart had a wee gartley
and so then I clicked buy with anticipation
but as yet the wee train hasn't left left the station🙁
tickets please😀
anyone think we got enough steam for the next station?
anyone think we got enough steam for the next station?
got more coal on now🙂
just hope it doesn't do a thomas the tank😆
Is that 5089 cash or futures we are looking for? Woolies get ready.
I got short from near the highs of the day and the market profile analysis, which I claimed gave me such a good understanding, got me out way too early😆
All credit to you for taking the short at the highs. The fact that you got out too early was not your fault. You could not foresee news events in market profile. I am guessing you got out around 5143.
We haven't hit 5089 yet but 5095 is close enough. I am hoping for a double bottom here, but can technicals overcome the fundementals here. Very bearish after Merkel and the gang.
Just out of curiosity, do you get your MP from esignal charts?
The volume has now finally dropped off and the Turkey and redcurrant is about to arrive. I have left a small range trade long from 5108 but I would imagine it won't stray too far from the 20 EMA on the 5 min chart until 6pm.
Just out of curiosity, do you get your MP from esignal charts?
The volume has now finally dropped off and the Turkey and redcurrant is about to arrive. I have left a small range trade long from 5108 but I would imagine it won't stray too far from the 20 EMA on the 5 min chart until 6pm.