Addressing the issue of time frames

Indeed it does DS. And everyone must find their own 'comfort' in trading. From the scalper who uses a 1 minute chart (or less), to the person that uses monthly charts.

This thread was an attempt to take a step back and to define what is the lowest workable timeframe.
I didn't start off as a scalper. But ended up as one. Yet now I prefer to mix everything together and use longer timeframes yet still 'scalp' where needed.

The lowest 'workable' timeframe for me to use was a 15 min. The best workable timeframe to use is the 8 hr chart.

Here is something I have been on for a while.
Circumstance demanded that I take a step even further back from what is considered normal scalping practises. There is nothing to stop anyone from scalping with a daily chart. Or even from a longer timeframe. Yet people still persist in going to the shortest timeframe they think is useful for beating the market; failing most times to see the whole picture and leave themselves at the mercy of price fluctuation without knowledge of where or what price has to show.

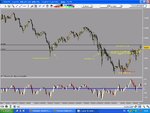
The longer view on this usd/jpy is long above 10.158 and short below 98.95.
Inside that channel, scalping is in order. Long @ 10.073 Target 10.158. With short from near where it is now with the problem of hitting congestion right away. 1st target @9,717
There are 2nd and 3rd targets for both directions but it's always the kiss of death to post predictions. A simple long above short below will do, with the scalpers mentality until the price actually decides where it it going to go. How often have those little 25/35 point/pip runs damaged the account?

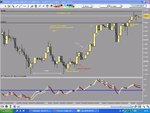
On such a clear chart as this. Does anyone know the answer to the question posed in the chart annotation?
 

Attachments

  • USD JPY 1.JPG
    USD JPY 1.JPG
    100.7 KB · Views: 251
I am agreed with you options. I believe myself to be something quite unusual in that I do "scalp" (take trades of short durations with relatively small profit targets), but the smallest time frame i use is 2min. In fact most of my entry areas are found using a 15min and 60min chart with the shorter timeframe used to hone entries. There seems to be a huge number of people using both 1min and tic charts who live and die by them with no idea about the "bigger picture". Whilst I am not saying it is impossible to scalp using only short timeframes and be profitable, what I would say is that there are situations where taking account of the bigger picture would save many scalpers from entering trades on a short time frame which run completely contrary to logic on large timeframes. I have seen more tic/1min scalpers than I can count short into 60min support and then wonder why price has moved against them when there is no support shown on their 1min chart.

This sort of answers your annotated question - why did you know this is a good area to take profit? You knew it was a good area to take profit because there is longer term resistance there - long term resistance which likely you would have been unaware of if you solely focused upon a very short-term chart. Resistance is an area where in the past sellers have been known to enter the mrarket and so if you are expecting sellers to enter the market when you are long (which will drive the price down) you may as well sell some/all of your position to maximise profit.
 
Excellent.

To know the future, you have visit the past.

The chart is self explanatory...

...But there are other clues.

Looking at the first chart again. "Blues tools" give another edge.
A perfect double bottom.
16 bars between bottoms.
And the next 16 bars bring the price action to an historic 'balance' point.

You have the the past reference point and then in real time, an unfolding time and price target.
 

Attachments

  • USD JPY1 ANSWER.JPG
    USD JPY1 ANSWER.JPG
    104.6 KB · Views: 238
  • usd jpy 3.JPG
    usd jpy 3.JPG
    99.8 KB · Views: 191
Always good to follow up on things.
The short call teased about a bit by dropping around 80 pips on first break before moving into the congestion channel and teased again by 45/50 or so, then stayed in channel for a couple of days before deciding to drop. Time of writing around 9700, so a safe little trade.

Second chart is same view but with the long above, short below indicator included. Calls the real move spot on. Safe entry, nice run.

Not shown on chart is trade op for Sun night/monday. Price should close for the weekend around where it is now and for next move a long is above 9746 and a short called for 9643. With the short still favoured. But it will do what ever it wants to do.
 

Attachments

  • usd jpy follow up.JPG
    usd jpy follow up.JPG
    87.7 KB · Views: 179
  • usd jpy follow up.JPG 2.JPG
    usd jpy follow up.JPG 2.JPG
    94.1 KB · Views: 202
Newbie

Hi Options,

Really started getting into this thread until i got lost, I missed the first part of it which may of explained what i'm about to ask, so i appologise for taking you back to the begining. With regard to your cycles, where are they obtained from? what data do you use to calculate them if any and what indicators are you using at the bottom of the screen? I am currently new (6months) to day trading on the cable market, i trade breakouts of support and resistance lines using technical and fundamental analysis to whittle out the good trades from the bad. I've been using the 15min chart, but keeping an eye on the larger time frames for more confirmed breaks. I like the look of this system and would love to learn more about it, but it is futile reading if I dont know how you got your indications in the first place :) thanks for reading.

Steve
 
Hi Options,

Really started getting into this thread until i got lost, I missed the first part of it which may of explained what i'm about to ask, so i appologise for taking you back to the begining. With regard to your cycles, where are they obtained from? what data do you use to calculate them if any
Glad you find it interesting. The cycles are from time and price. That simple. Time elapsed from whatever timeframe you are following to another point in time on the same chart. The price displayed as bars on these charts simply make it pretty to look at and easier to plot time traveled.
That reads a lot harder than it actually is.

and what indicators are you using at the bottom of the screen?
They are of my own making and stay with me I'm afraid. The main one took over 10 years to reach its present state and yet it is only an indication of what may happen.
It's right about 8 out of ten times. But what about the other 2 times? If you could tell when it was going to be wrong it would be fantastic.
Price will always rule. Everything else, indicators, leading and lagging. Cycles, waves etc come a poor second. They are all useful if you understand them and how to use them, and they all have their place, but don't get lured in by their beauty.
Keep trading the breakouts, from price action, that's all you really need.
This thread was an attempt to plot the smallest usable timeframe to trade comfortably from. 15 min proved the smallest from my view. You can trade from sub minute charts of course and I have done so. But it is easier to get 'drawn' into wrong moves. 15 mins give you a bit more time to think. Daily charts even more.

The bottom indicator just affords an easy assesment of possible ops.


I am currently new (6months) to day trading on the cable market, i trade breakouts of support and resistance lines using technical and fundamental analysis to whittle out the good trades from the bad. I've been using the 15min chart, but keeping an eye on the larger time frames for more confirmed breaks. I like the look of this system and would love to learn more about it, but it is futile reading if I dont know how you got your indications in the first place :) thanks for reading.

Steve
.
 
ahhh that would explain alot if you made the indicators up yourself, impressive. And yes i really did enjoy reading, you would make a good teacher. haha. thanks for answering the questions, it makes a change talking to someone about this, since i dont know anyone that does anything any where near similar...

all the best :)

Have a look on here for threads by Kool Blue and hwsteele They both have an interest in this type of thing. Both very knowledgable in cycles and cycle prediction. Certainly taken it further than I have.
I think Blue still has a sort of live thread going on the ES at another site. Being American he trades that, so best time to link up is in the afternoons.
 
You are rigth. I scalp using tick, 1 min., 15 min. and 1 hour, sometimes it gets really boring to get some pips but anyway it works, it seems to me that using the time frames you say will help me to make less bad trades. Any way, the way i do it works, some days i get a yield of 0.7% and others - like last thursday - i got above 7.5% but since i had some bad entries i had to sacrifice it and finally i got an exellent 4.5% for the day. Obviously to do these i make a LOT of entries.
I will try to use longer timeframes and see how it works.
 
I want to buy a system wont mind paying.Can you recomend any please? There is one guy charging £1000 to me its too much. Has anyone had any success with it? nosecretstrading .com. There are too many bsers out there.
ty
 
I want to buy a system wont mind paying.Can you recomend any please? There is one guy charging £1000 to me its too much. Has anyone had any success with it? nosecretstrading .com. There are too many bsers out there.
ty

I have never heard of them. That is a lot.
Best thing to do is try and find a try out about other software packages, test them out with free try outs. Some offer a month sub.
 
I use 1minute chart for my scalping and have found it very affective for the past 4 years.

I havent even looked past 5 minutes to be honest, however not adverse to trying. What would you say the benfits of longer time frames are?
 
what do you all use for time frames? 15 minutes 30 , 10? 60?

This depends on you. You are going to get loads of opinions on this! What do you want to do? It depends on risk management, in great part. Each trade will have a stop level and the higher the TF the more risk you take on board if you use price activity and bar watching as guides because, logically, the bigger the TF, the more points the price bar covers.
 
I want to know what is the best time to take pivot readings, when do u take pivot readings?
 
I use 1minute chart for my scalping and have found it very affective for the past 4 years.

I havent even looked past 5 minutes to be honest, however not adverse to trying. What would you say the benfits of longer time frames are?

More money! My 'scalps' mow last for 40 pips at least.
 
I want to know what is the best time to take pivot readings, when do u take pivot readings?

Pivots work in all time frames. They are a self fulfilling prophecy.
Whether it will bounce from or carry on is another matter!
 
I thnk that it makes sens using at least 3 different time frames for an intra-day activity
5 minute chart
30 minute chart
4 hours chart

daily & weekly chart are for long term analysis but you should place your trades using the 5 minutes one because of the volatility that markets have nowadays
 
Top