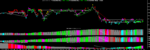
Calculating support and resistance levels based on historical price action is simply an assumption that buyers or sellers will re-appear at a particular level because that level had support or resistance yesterday or maybe several hours ago. It just doesn't play out that way often enough to make that approach useable in my experience. I attached a chart from an analysis service I subscribe to and their indicators show me when the market is running into support or resistance in real-time based on their analysis of program trading in equities, futures, options, and etf's. The analysis is quite different than anything else I have used before. When the coloring is too confusing I know not to trade, when I can see something obvious happening I can trade with a little more confidence and hang in the trade longer. I asked them for a big chart and I added the lines myself to make my point. Just thought it would be informative.