A Professional Approach to Trading Futures

No Inquiries as to how to anticipate a possible breakout?

The answer to that question is simply (the end of the IB period)
Institutional algos activated by time of day, look for this opportunity to
trap volume. With all the resting orders under the trading range, it is
relatively easy to wait, until enough orders show up on the books, then
at the end of the IB, break to the downside (in this case)

Good luck
 

Attachments

  • End Of IB Breakout.PNG
    End Of IB Breakout.PNG
    135 KB · Views: 28
Last edited:
Hello Traders

Here in California it is almost 9pm and we have completed our
"homework". We will post a version of our Weekly Markup that
illustrates the Institutional process of "trapping volume".

The larger context for this is shown by a fixed range Volume Profile
anchored Monday of the previous week. We direct your attention to
Monday of the current week. Notice how price reacts when it tests
the Previous Week's Value Area Low, not once but on consecutive
tests (Monday, Tuesday, AND again today.

As we have said previously, it is common practice for Institutions to
act at specific times (prices) in order to "Trap Volume". Notice that we
do not use the phrase "Trapped Buyers or Sellers", why? Because the
majority of this volume is automated.

For Skilled Professionals, the challenge is to identify this framework
in time to make use of it. Once you see it, obviously you "go with" it
Entering as close to the origin of the move as possible, holding on
as long as possible, or as long as your risk metrics will allow.

We are near the end of the week, and no one has engaged to know
more about this process. For those who use TradingView, we suggest
extending a Fixed Range Volume Profile to each of the next sessions
and ask yourself what comes next?

Learning to answer that question is the primary goal of our class.

Good luck
 

Attachments

  • Weekly Cycle Dec 17.PNG
    Weekly Cycle Dec 17.PNG
    141.4 KB · Views: 12
Here is that chart with Volume Profile extended
and the question is put to everyone
What comes next?
 

Attachments

  • Moving VP Forward.PNG
    Moving VP Forward.PNG
    137.9 KB · Views: 13
and our chart showing the transition to London Session

As can be seen, the answer to the question lies
with what happens during the London Session
It will provide clues whether price will move up to
test the overhead "References" (Value Area Low, and
Anchored VWAP from previous session, OR perhaps
break to the down side

Based on what happens during the London Session
we will create reasonable plans to trade the US session
(as usual)

Good Luck
 

Attachments

  • Transition to London.PNG
    Transition to London.PNG
    145.6 KB · Views: 13
London Session Trades after the transition (previous post)

For those interested in the US session, it looks as though
Institutions are going to move the market up to test previous
Key References (again refer to the previous)
 

Attachments

  • London Sesson Dec 18.PNG
    London Sesson Dec 18.PNG
    144.7 KB · Views: 8
Good Morning or (in 10 minutes) Good Afternoon London & Euro Traders
where it is currently11:50am

Here is our preliminary comment regarding High Impact Economic News
------------------------------

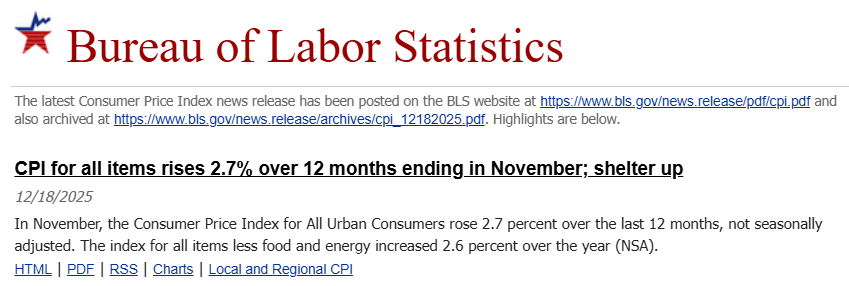
Our primary focus for this morning is the November Consumer Price Index (CPI), to be released at 8:30 AM ET.
This report is critical because it is the first major inflation data released following the recent US government shutdown,
ending a period where the market was effectively "flying blind" on price trends. Further comment as follows

  • Consumer Price Index (YoY): Consensus: 3.1% | Previous: 3.0%
  • CPI (MoM): Consensus: 0.3%
  • Initial Jobless Claims: Forecast: 225,000 (Improvement from 236k)
  • Philly Fed Manufacturing: Forecast: 2.0 (Rebound to Expansion)
"Whisper" & Analysis

The Data Gap Risk: Because the US government shutdown disrupted data collection (causing gaps in October reporting),
volatility is expected to be higher than usual. The "Whisper" worry is that inflation may be stickier than the 3.1% forecast
suggests, potentially complicated by early tariff impacts.

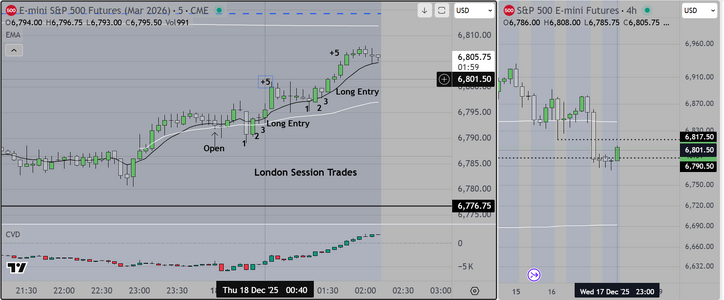
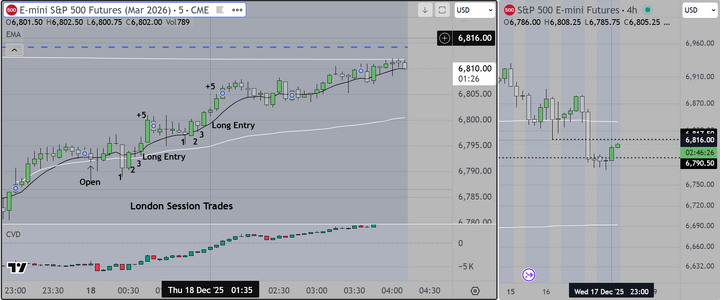
*Market Sentiment: S&P 500 futures are trading higher (+0.4%) this morning, largely driven by strong earnings from Micron (MU), which has reinvigorated the AI trade and offset some pre-data anxiety.
------------------------------------------

Trading Plan Scenarios

Bull Case: If CPI arrives at 3.1% or lower, expect the "Santa Claus Rally" to resume with force, as it confirms the Fed can continue cutting rates.
In our opinion, it looks as though "informed" participants believe this is likely.

Bear Case: Conversely a "Hot" print (>3.2%) could trigger a sharp selloff, as it would validate fears that tariffs are reigniting inflation and forcing the Fed to pause. In my opinion this is about a 30% percent possibility, Although the impact would be significant if it were to materialize.

-------------------------------------------

Tomorrow (Friday)

Quadruple Witching: regardless of today's close, tomorrow (Dec 19) is a quarterly expiration event for futures and options.
Expect massive volume and erratic price action, especially in the final hour of trading. We suggest that
Retail traders observe only. For those with experience, we would be watching for a spike move (on Open) lasting
about 15 minutes, followed by a strong reversal as institutions use money to move markets toward positions
that will put them "in the money" as regards hedged (options) positions. While we do not have the time
to explain in detail, skilled professionals already know which side of the market institutions are on in terms
of hedged positions, and so they will wait for them to make the "first move" then jump on the train with them
Again a skilled person can find all the information (if they know where to look) on the CBOE website and it
is part of the education we provide in order to teach traders how to obtain a tradable edge in the Markets.

Good Luck
 
Last edited:
Here is an update on the Long Trade Entries
shown in the prior posts above

Apparently those entries have hit their overhead targets
and those traders have +20 and will likely exit in this area
to protect profit
 

Attachments

  • Update London Session.PNG
    Update London Session.PNG
    139.7 KB · Views: 5
and here is the reaction to the release of the Economic New we
talked about previously. We will trade this using the "Rule of 4"
setup (also referred to previously).

Good luck
 

Attachments

  • Reaction to news DEC 18.PNG
    Reaction to news DEC 18.PNG
    152.2 KB · Views: 4
And this is the data sent to my attention

As can be seen, inflation was above expectation and
it is assumed that the odds of another interest rate
cut increase, thus the move higher

For those who take this professional seriously, this is
an element that needs to be understood, and (at some point)
made part of a reasonable trading plan.

Good luck
 

Attachments

  • Sent to my mailbox.PNG
    Sent to my mailbox.PNG
    35.7 KB · Views: 7
Good Afternoon London & Euro Traders

I assume that most of you are "without a clue" as to
how to handle a "Trading Range Open". We attach
a chart showing our preferred strategy for this condition

Step 1 Identify bias (As mentioned in previous posts, look
at the way London Session trades. Obviously to the upside
Step 2 Identify the reaction after release of High Impact Economic
News (also to the upside)
Step 3 Watch the first few candles and mark your "Bookends". We
have used this technique for years and it is reliable. Referring
to the chart below, see the side by side candles. We draw a horizontal
line extending from each (one at the high, one at the low) to define
the early range

Now we are ready to trade. as shown on the chart, the final step is to observe
a "move" from one side of the range to the other. It has to be in the preferred
direction (after all that work, it better be, right?)
Watch the first, then wait patiently for the next opportunity at the same price level
Enter the trade with a reasonable stop loss in place. Monitor the price action and hold
as long as the position stays above your entry. Profit targets are overhead (we discuss in
our class). Success is about preparation, and the ability to execute (and to manage your
emotions). If you have been on the losing end for a while, you will want to get out quickly
with small profit. That's understandable. Repetition and watching a skilled trader execute
correctly is what you need

Good luck
 

Attachments

  • Trading Range Strategy 1.PNG
    Trading Range Strategy 1.PNG
    122.8 KB · Views: 8
and here is an update as this one broke strongly to the upside

If you compare the timing to the posts you will see that I am posting
this BEFORE it happens.

Ultimately this was a +40 pt move, equivalent to +2,000 USD/contract
(if you held it). Even if you only took +10 it was a nice profitable trade
and then you move on to the next opportunity

The question I would put to all of you is "Do you see what is in front
of you". Do you want to continue to make widgets, or sell office supplies
or whatever else you do for a living, OR would you like to create a sustainable
business or maybe just a consistent 2nd income.

Good luck
 

Attachments

  • Trading Range Update.PNG
    Trading Range Update.PNG
    152.2 KB · Views: 7
Last edited:
Attached below, please find our Weekly Cycle Markup (Wed thru Fri)

Important to note the position of the Value Area High & Low (how they frame the market)
and, the position of the Value Area Low lines up with a price point that is expected to be
a point of contention. Institutions will want to defend 6,800 to keep their options positions
"in the money".

Good luck
 

Attachments

  • Weekly Cycle Back Half Dec 18.PNG
    Weekly Cycle Back Half Dec 18.PNG
    120.8 KB · Views: 6
Hello London & Euro Traders

The attached chart illustrates a principle that we were taught more
than a decade ago, and that is to learn to identify "Repetitive Behavior"
(also known as "Repetitive Price Patterns"). As mentioned previously, I was
taught that learning to identify these types of patterns was invaluable because
it aligned with professional "best practice" and it allowed me to get in early and
to exit when "uninformed" traders were entering late ("chasing the market").

Context is critical of course, and the attached chart tries to outline that context.
We also show the repetitive setups (all of them are "1-2-3") and our process as
always is to identify the first example, which happens early at the open, then
trade the examples that follow. If a trader waited patiently for these repetitive
price patterns, they would have had a profitable day, with very little risk.
 

Attachments

  • Overnight Cycle Part 1.PNG
    Overnight Cycle Part 1.PNG
    139.1 KB · Views: 8
Good Afternoon London & Euro Traders
It is about 1:30pm in London

This is part of the Introductory Comment that we provide students each week
------------

The week of December 22–26, 2025, is a holiday-shortened trading week with generally low liquidity and limited high-impact economic reports.
The most significant reports scheduled for release are:
  • Q3 GDP (Third Estimate)
  • Durable Goods Orders
  • Personal Income and Outlays (PCE data)
US markets are closed on Thursday, December 25, for Christmas, and trading volumes will be light throughout the week.

Overall, while these reports have the potential to move the market, the low trading volume typical for the holiday week means that any data "surprises" might cause exaggerated, albeit short-lived, volatility. Generally we monitor this period, only trading if we see a significant reason. During this
holiday, institutions use their "2nd Team" staff, directing them to simply manage the mostly automated programs, and not to act unless an unusual
news event occurs (in which case they are to call them for further direction). In New York for example, senior trading staff generally arrange for
transport via hired vehicles at about 10 to 11am local time.
 
Last edited:
And here is our "Previous Holiday Chart, showing price action last year
at this time.

Notice that the Friday prior to Christmas (last year) was a strong up day
Compare that to this last Friday. The similarities are interesting.
One of the principles we teach is to make use of the human tendency
to create "Repetitive" behaviors, especially during certain times of the year.
On you own charts, look at how the S&P 500 Futures traded this last Friday.
Those of us who work in the industry look at these as "Gift" days.

Good luck
 

Attachments

  • Previous Holiday Chart.PNG
    Previous Holiday Chart.PNG
    92.2 KB · Views: 5
Hello London & Euro Traders

Here is our pre-open comment for Monday's NY Session
----------------

Evaluating Friday's NY Session Chart Markup​


  • Friday close: Strong & directional
  • No late liquidation:
  • Likely stops:
    • Below Friday NY low
    • Below overnight VWAP if tested
  • Unfinished business:
    • Weak highs still likely above
    • Composite value migrating upward

➡️ This strongly favors Monday continuation or controlled rotation higher, not reversal.

5. Globex & Monday Open Expectations

Scenario A (Highest Probability – ~60%)

Gap up or open above Friday value

  • Expect:
    • Early chop
    • Shallow pullbacks
    • Acceptance above Friday value
  • Best trades:
    • Pullbacks to VWAP / value low
    • Opening range high acceptance

Scenario B (Secondary – ~30%)​


Open inside Friday value

  • Expect:
    • Monday rotation first
    • Buyers defending value low
    • Expansion later NY session
  • Best trades:
    • Responsive long at value low
    • Break & acceptance above value high

➡️ Still a long-only framework unless value fails

Scenario C (Low Probability – ~10%)​


Hard rejection below Friday value

  • Would require:
    • Strong selling volume
    • Acceptance below Friday low
  • Only then:
    • Short rotations back to composite value

➡️ Until that happens, shorts are countertrend scalps only

Institutional Bias Prediction​


If price accepts above Friday value, I expect continued upside rotation and possible range extension toward weak highs.
If price rotates lower but fails to accept below Friday value, I will look for responsive long entries.
Only acceptance below Friday low invalidates this bias.

As long as ES holds above 6822, I will look for long setups targeting weak highs, accepting that volatility will be slow and rotational due to holiday conditions
 

Attachments

  • Wednesday to Friday Cycle Example.PNG
    Wednesday to Friday Cycle Example.PNG
    103.5 KB · Views: 5
Good Day People of London
Its about 1:30 Local Time

I imagine you widget makers are hard at work
For those few who might actually trade for a living
its past time to get ready

During this season we take advantage of the fact that
London may occasionally lead the Weekly Cycle. THIS is one
of those times

The chart tells the story

We anchor two VWAPS, the first at the previous Monday
to show the position of Value Area High/Low for the week
the second, at the open of the New York Session on Friday
Notice the confluence of Value Areas (they overlap)

The preferred initial strategy is to monitor for at least 5 to 10 minutes
then to evaluate price action and make a decision to act. The key references
include the London Session high & Low, and the Value Areas shown on the
Charts. We would hope for what professionals call a "Clean Test" and move
higher, but of course the markets will do as they please.

We will be using our TradingView chart as shown, but changing (toggling)
from 15 minute candles to 3 minute candles, We will execute on our Ninjatrader
screen, and we have an automated order ready to go that will take a minimum
of 5 points initially, for a portion of our position, then hold the rest to 10 pts
with a breakeven order in place to protect that money.

Given that no one seems to have found their voice, we hope you learn something from
this and perhaps benefit from it.

Good luck
 

Attachments

  • Weekly Cycle Anchored VWAP Example.PNG
    Weekly Cycle Anchored VWAP Example.PNG
    127.3 KB · Views: 5
Good Afternoon London & Euro Traders

Here is my 3 min chart for the S&P 500 Futures
As can plainly be seen, there has been no Rally (we expected one)
Instead "Trading Range"

So item 1, it how to adjust our world view to align with what we see on the screen
First, we Identify the price action, and we do this by noting the range and overlap of
candles

Item 2, We mark our "Bookends". This is a very reliable way to frame the Trading Range
AND it allows us to find profitable entries at the extremes

Item 3, refers to a principle that we outlined previously. We look for repetition we see an example
of price reversing at the high or low of the range, then we trade the next test (and the next if the previous
was profitable).

Item 4, we put on our trade(s) with a reasonable stop lose and we expect to exit at the midpoint of the range
If we are trading multiple contracts we look to hold part of our position to the other side of the range.

Its that simple. It requires that the trade pay attention, identify the conditions, and be ready to act on time
Late entries are mostly losers, WHY? because institutions rely on late entries. They sell into those entries
They are getting out, where late entries are likely to get in.

Good luck
 

Attachments

  • Dec 22.PNG
    Dec 22.PNG
    81.4 KB · Views: 3
And here is the rally we anticipated, and it is happening at
the end of the US/Euro Overlap

We can answer questions otherwise we will simply post the chart
You've got this, right?
 

Attachments

  • Dex 22 Breakout.PNG
    Dex 22 Breakout.PNG
    78.3 KB · Views: 3
Back
Top