A Professional Approach to Trading Futures

Good Morning London & Euro Traders
It is 10:30 am in The City

Attached please find my Weekly Markups
These charts are the basis for my decisions as to bias
and probable institutional intent during the "Front Half"
of this Weekly Cycle (Week of Dec 15, 2025)

I will add to this as more information becomes available to me
in anticipation of several opportunities during the NY Session
1) During the Open (Initial Balance)
2) At the Close of US/Euro Overlap
3) During the Last Hour (Power Hour) as MOC orders are placed

Updates to follow
 

Attachments

  • Weekly Markup Dec15.PNG
    Weekly Markup Dec15.PNG
    131.1 KB · Views: 16
And the chart attached below shows the same view basically
but with an added Daily Chart which incorporates Anchored VWAPs
in the same fashion that an institutional trader would use them
to show the obvious yearly upside trend and possible points of entry
for HTF investors. This shows the view that "informed" participants
have of their "VAR" positions (essentially their brokerage accounts)

Also please note that the left side of the chart (time frame) changes to 30 minute
candles. This is also standard (best practice) in order to make decisions regarding
trend or trading range (intraday) and for persons who may want to structure or maintain
longer time frame positions.

Good luck
 

Attachments

  • HTF Display Week of Dec 15.PNG
    HTF Display Week of Dec 15.PNG
    134.5 KB · Views: 9
Last edited:
Preparation for the open of the NY session includes
evaluation of the impact of the following scheduled
release of High Impact Economic Reports

Monday will be relatively quiet as regards Economic News
from US sources, however starting Tuesday we have several
important releases as follows
  • Tuesday, December 16:
    • U.S. Nonfarm Payrolls: The delayed November jobs report is a key focus for markets and the Federal Reserve's interest rate policy decisions. Other related labor market data to be released simultaneously includes the Unemployment Rate and Average Hourly Earnings for November.
  • Wednesday, December 17:
    • EU Consumer Price Index (CPI): The release of the Eurozone's inflation data for November.
  • Thursday, December 18:
    • U.S. Consumer Price Index (CPI): The November CPI data and core CPI are critical inflation updates that will influence market sentiment and future rate expectations.
  • European Central Bank (ECB) Monetary Policy Decision: The ECB is scheduled to announce its latest interest rate decision.
  • Bank of England (BoE) Rate Decision: The BoE will also release its policy decision.
  • U.S. Weekly Jobless Claims Report: The regular weekly update on labor market health.
The timing of each of these is important. Typically we obtain a consensus for each report if one is available
and then we review the previous price action for each report prior to the trading day. This provides a basis
for creation of a trading plan. Based on this preparation, we go into the NY session with an idea of how
price action will proceed (Initial Bias, how to confirm, or if price action diverges from our preliminary
prediction, how to quickly adjust).

Good luck
 
And here is an example of the consensus for the Nov Jobs Report which is released late
due to the US Government Shutdown

U.S. November Jobs Report (Due December 16)

The consensus among economists for the delayed November jobs report indicates a continued slowdown in hiring activity.
Analysts anticipate that the overall headline job figures will be somewhat "noisy" or distorted due to federal government job cuts stemming from earlier buyout offers, which could drag down the total number of jobs added.
and
U.S. November CPI Data (Due December 18)
For the inflation report, expectations point to both headline and core inflation remaining above the Federal Reserve's 2% target.
The monthly headline CPI increase is expected to be primarily driven by a surge in gasoline and energy prices. However, some analysts note that seasonal adjustments might make the reported figure seem higher than the real-time experience for consumers.
The combined data from these reports will be heavily scrutinized by the markets and the Federal Reserve to determine whether December's recent interest rate cut was a cautious adjustment or the beginning of a more sustained easing cycle

Our evaluation is as follows

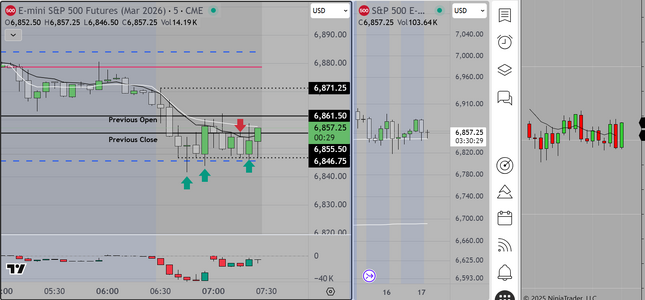
The S&P 500 futures market response this week will likely depend on which data set "surprises" the market more: the labor report or the inflation report. The S&P 500 has been trading near record highs, partly on the expectation that the Federal Reserve can continue to cut rates, an assumption that relies on both a cooling job market and cooling inflation.

Potential Scenarios for S&P 500 Futures
  • Bullish Scenario (S&P 500 rallies): If both reports align closely with the expected "soft landing" narrative (i.e., a weak jobs report is matched by a tamer-than-expected CPI increase), the S&P 500 futures could climb. The market views a weakening labor market as a green light for further Fed rate cuts, which is generally positive for equities, provided inflation is also under control.
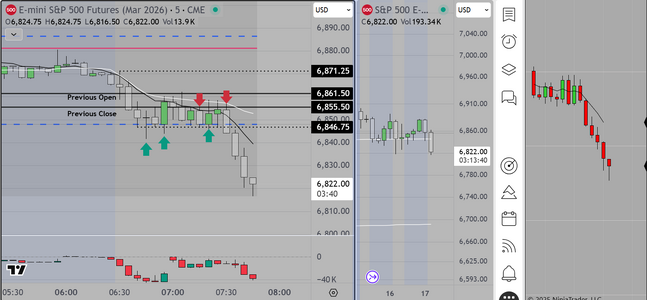
  • Bearish Scenario (S&P 500 sells off): The most significant risk for a sharp downturn in futures would be the combination of weaker-than-expected jobs data (pushing recession worries) and a higher-than-expected CPI print (suggesting sticky inflation). This would create a dilemma for the Fed and likely cause volatility and selling pressure as investors worry about "stagflation" or that the Fed has less flexibility to support the economy.
Mixed Reaction (Volatile, little net change): This is highly probable given the current forecasts.

Key Data Point to Watch
While the headline jobs number gets initial attention, wage growth (Average Hourly Earnings) and core CPI figures may be more important for Fed expectations and thus more likely to drive sustained S&P 500 futures movements. An acceleration in wages would likely unnerve the market, capping equity gains

This post is a "one time" event to show interested parties how we prepare. Future presentations will happen in the class.

Good luck
 
Last edited:
We address this to struggling traders who might want to ask themselves
the following questions

1) How committed are you to trading as a profession
2) Are you willing to spend the time necessary to study, to prepare, AND
to learn from your mistakes
3) Finally, can you convert what you learn from your mistakes into a positive
new course of action.

"Successful" professionals admit to themselves that they are likely to make
mistakes (regularly) but they come at this from a position of humility.
They know that success comes from minimizing loss and avoiding repetitive mistakes

While I am thinking about this I want to recommend a book by Tom Hougaard, also
known as TraderTom. "The Best Loser Wins".
 
London Session Trade
Based on the following

Daily chart shows obvious bias at Anchored VWAP
30 min and 15 min charts confirm
5 min chart shows 1-2-3 setup during London Session
Previous Weekly Chart shows short volume trapped
 

Attachments

  • Dec 15 London Session Trade.PNG
    Dec 15 London Session Trade.PNG
    110 KB · Views: 10
Good Early Morning London & Euro Traders
It is a little after 5am in the City

We attach a Weekly Chart. Some readers may remember that we divide the week
into a Front half and a back have, with Wednesday as a "pivot". In this instance
Wednesday is particularly important, because of the FED decision to cut Interest Rates.
We anchor a VWAP to the time of the announcement. From that point forward it is
thought to be a "Key Reference" in that it influences decisions to put money to work
in the markets (on both the buy & sell sides).

Absent any specific high impact news, we would anchor a VWAP at either the settlement
or RTH close of the NY Session.

In our class we talk about this in detail, and we show traders how to decide where to anchor
the VWAP (it changes day to day, week to week). We also inform traders as to the way to frame
the market using the Value Areas High & Low, and the way that price reacts at the boundaries.
Professional traders use specific protocols to frame, and identify opportunities as each week
develops.

Good Luck
 

Attachments

  • Transition Day Chart.PNG
    Transition Day Chart.PNG
    131.8 KB · Views: 7
Good Afternoon London where it is
12:44 and we are getting preparing to
trade the NY session of the S&P 500 Futures

Interested readers can scroll up four (4) previous posts
to find our list of High Impact Economic Reports that
will be moving markets

Scroll up three posts and see our Preliminary Trading
plans

Those of us who have been doing this for a while develop
a network of contacts, whom we can trust to provide accurate
"Whisper" commentary as regards expectations for each market
session. As of this time, there is nothing other than what we posted
affecting the markets.

Prior to the open we will review London's session to see if it has gone
as planned or if our plan requires adjustment. If so, update will follow

Postscript

Attaching our Higher Time Frame (Daily, Weekly) charts so that readers can
see where we are in the larger distribution. Now the question is "how will the
US Market react to the release of delayed economic news. We will all see
shortly

Good luck
 

Attachments

  • Daily Weekly Chart Markup Dec 16.PNG
    Daily Weekly Chart Markup Dec 16.PNG
    144.9 KB · Views: 7
Last edited:
Initial reaction to the release 1:30

For this kind of event I use an entry setup known as
"Rule of 4". I will elaborate later
 

Attachments

  • Initial Reaction.PNG
    Initial Reaction.PNG
    104.7 KB · Views: 8
Attaching my 5 min chart showing the result
for my version of the "Rule of 4" strategy

What I like about this is that it gets me in and out
before the NY open and in this case happily with +9
 

Attachments

  • Rule of 4 Trade.PNG
    Rule of 4 Trade.PNG
    50.6 KB · Views: 8
Looking for the market to reverse here trapping shorts

So far Trading range

Thus far the market is continuing lower
My initial assumption was wrong and I will adjust accordingly
 
Last edited:
As can be seen in the attached chart
Price is stalled at the low of the weekly range
and we are not "seeing" the market as well
as we would like so we will take a break and
come back for the Power hour trade

Good Luck
 

Attachments

  • Weekly Cycle Markup 16 Dec.PNG
    Weekly Cycle Markup 16 Dec.PNG
    118.2 KB · Views: 9
And as promised in the post above, the "Power Hour" trade
which typically occurs during the last hour of the NY Session.

There are a variety of setups that seem to work for
this opportunity. As with so many concepts relating to
trading it is easy to see in hindsight, but more challenging
to see it develop and to actually trade it. We have posted
about this previously (several times). We recommend Retail
traders observe as a skilled person trades it first, then when
they have a feel for the concept, it can be a significant source
of income. In this case it hit +20 before traders started to
take profits.

Postscript

I just revised my chart to (hopefully) make it easier to understand
The concept is simple. We hope to catch an end of day trend or
a reversal based on profit taking at the end of the session.
We always look for the MOC bar, which is where institutions re-balance
their books. It always has unusually big volume as compared with the
bar previous and after

Good luck
 

Attachments

  • Power Hour Dec 16.PNG
    Power Hour Dec 16.PNG
    98.1 KB · Views: 7
Last edited:
Good Afternoon London & Euro Traders
It is 1:15pm in The City

Here is my Chart Markup for the London Session of the S&P 500 Futures
This is a 1-2-3 setup that is difficult to markup. Simply put the chart becomes
cluttered and difficult to understand. This is why I recommend that interested
traders request an invitation to my LiveStream (when it happens).

The result it what I would call "Typical", that is to say, most skilled commercial traders
are looking for +10 before they take exit. For retail traders we suggest trading a minimum
of two (2) contracts, taking one off at +5 (this is called "buying a stop), then exiting
the entire position at +10, if it continues or just below +5 if it retraces to that price point.

Good luck
 

Attachments

  • London Session Basic Setup.PNG
    London Session Basic Setup.PNG
    107.1 KB · Views: 4
Schedule of High Impact Reports scheduled for release tomorrow
as follows

  • Major "high impact" reports, including the Consumer Price Index (CPI), are scheduled for release later this week, specifically on Thursday, December 18, at 8:30 a.m. ET.
  • Yesterday's release of the November Employment Situation report showed continued weakness in the labor market, with the unemployment rate rising to 4.6%.
  • The only other morning events are speeches by Federal Reserve officials, including Christopher Waller at 8:15 a.m. ET and John Williams at 9:05 a.m. ET, which can sometimes move markets depending on their comments.
Our pre-market preparation and creation of trading scenarios will be reserved for LiveStream sessions only

Good luck
 
I thought I would give interested traders a look at my pre-open screen
on the left is my TradingView display divided into halfs, and on the right
my Ninjatrader screen (my live account). I execute from this side

Good luck
 

Attachments

  • LiveStream Setup.PNG
    LiveStream Setup.PNG
    139.2 KB · Views: 4
Todays trades
I have changed my markup hoping this will be easier for
the viewer to read
The price action would have been challenging for a retail trader
because it required skill with limit orders and the entries were for the most
part counterintuitive. Primarily longs at support
 

Attachments

  • Dec 17 Trades.PNG
    Dec 17 Trades.PNG
    135.6 KB · Views: 4
This is funny and so typical
I missed this last entry because I was posting
 

Attachments

  • Dec 17 Missed Entry.PNG
    Dec 17 Missed Entry.PNG
    135.2 KB · Views: 4
And got back (to my screen) in time to catch this one

For Retail Traders, the logic is simple, this is a trading range day
You define the range and you enter "blind" at the extremes
with the understanding that at some point you will be wrong
and have to choose whether to scale in higher or lower.

I am done (for a while) having hit my daily goal (for this type of
day) of +20. My risk management rules require that I protect this
profit, until the last hour, when I have a possible "Power Hour"
trade that may or may not develop.

Good luck
 

Attachments

  • More Dec 17.PNG
    More Dec 17.PNG
    133.7 KB · Views: 4
And here is a last chart showing the break to the downside
No I did not catch this one, but had I been paying attention to
my business (as I should) I might have given it a go. I was (after all)
short when it happened.

Finally, some guidance as regards choice of direction for these trading
range entries. You have two choices and the odds are 50/50 right (wrong)
there is a way to identify a preferred direction anticipating a breakout
I cover that in my class (and THAT is why I was short when the market broke down)
Hint, it has to do with time of day

Good luck
 

Attachments

  • Dec 17 Breakout.PNG
    Dec 17 Breakout.PNG
    134.1 KB · Views: 4
Back
Top